Beyond the Boom: Decoding the Economic and Technological Undercurrents of the Global Renewable Energy Market (2026-2034)
The global renewable energy market is set to grow from $1,078.7 billion in 2025 to $1,838.57 billion by 2034, at a CAGR of 6.17%. While Asia Pacific dominates with a 71.72% share, this article goes beyond headline numbers to uncover the hidden economic logic: the divergence between high-growth regions and slower, mature markets like North America. It explores how rising CO2 emissions (up 1.1% in 2023) paradoxically accelerate renewable adoption, and how AI-driven forecasting tools—like IBM’s 92% accuracy platform—are reshaping grid reliability and investment risk. We dissect supply chain bottlenecks, regional energy policies, and the strategic implications for investors and utilities navigating this 9-year forecast horizon.
Beyond the Boom: Decoding the Economic and Technological Undercurrents of the Global Renewable Energy Market (2026-2034)
**By a Senior Technical/Financial Audit Journalist**
---
1. The Billion-Dollar Growth Engine: Market Baseline & Forecast Accuracy Check
The global renewable energy market stands at a precise inflection point. Valued at $1,078.7 billion in 2025, the sector is projected to expand to $1,838.57 billion by 2034, reflecting a compound annual growth rate (CAGR) of 6.17% over the 2026–2034 forecast period (Source 1: Fortune Business Insights). This headline trajectory—a nominal addition of approximately $760 billion in market value—merits rigorous scrutiny beyond the top-line figures.
Cross-referencing the baseline data reveals a steady sequential progression: the 2026 projection of $1,138.71 billion represents a year-over-year increase of 5.6%, while the terminal 2034 value implies a cumulative growth multiple of 1.70x. The 6.17% CAGR, when adjusted for global inflation rates averaging 3–4% across developed economies during the same period, narrows the real growth rate to approximately 2–3% annually. This discrepancy raises a critical question: does the reported CAGR reflect genuine capacity acceleration, or is it partially an artifact of inflationary pressure on equipment, installation labor, and financing costs?
Real-world barriers temper the optimism embedded in these projections. Permitting delays in jurisdictions such as Germany and the United Kingdom have extended project timelines by 12–18 months beyond initial schedules. Grid congestion, particularly in regions with high renewable penetration like California and South Australia, has forced curtailment rates of 5–8% for solar and wind assets, effectively reducing revenue-generation potential. These structural frictions suggest that the headline 6.17% CAGR represents a *potential* ceiling rather than a guaranteed floor, contingent on regulatory streamlining and grid modernization keeping pace with generation additions.
---
2. The Asia Pacific Paradox: Dominance, Dependency, and the Supply Chain Leverage
Asia Pacific commanded a staggering 71.72% market share in 2025, corresponding to a value of $730.08 billion (Source 1: Fortune Business Insights). This dominance is not merely a function of geography but of concentrated industrial architecture. China alone accounts for approximately 80% of global solar photovoltaic (PV) manufacturing capacity and 60% of lithium-ion battery cell production. India’s wind energy expansion, targeting 140 GW by 2030, adds further heft to the region’s installed base. The economic logic is clear: economies of scale in manufacturing drive down unit costs, enabling massive deployment volumes that smaller markets cannot replicate.
However, this concentration creates a structural vulnerability. The rare-earth mineral supply chain—critical for permanent magnet wind turbines and certain battery chemistries—remains heavily dependent on Chinese processing facilities, which handle over 90% of global rare-earth refining. Any geopolitical disruption, whether trade sanctions, export controls, or logistical blockades, could cascade through the entire global renewable supply chain. The overconcentration in solar panel and battery manufacturing represents a single-point-of-failure risk that market diversification has not yet resolved.
In stark contrast, North America’s 12.89% market share ($139.00 billion in 2025) tells a different story. The region’s 2026 projection of $143.97 billion indicates modest absolute growth of 3.6% year-over-year—below the global average. Yet the composition of this value differs fundamentally from Asia Pacific. North American markets generate higher per-unit revenue through integrated services: advanced grid management software, energy storage optimization platforms, and long-term power purchase agreements (PPAs) with premium pricing. This is a *value-per-watt* versus *volume-of-watts* divergence. The United States, through the Inflation Reduction Act (IRA), is deliberately subsidizing domestic manufacturing to reshape this asymmetry, but the 2026–2034 forecast period will likely see only partial rebalancing.
---
3. The CO2 Disconnect: How Rising Emissions Fuel the Renewable Urgency
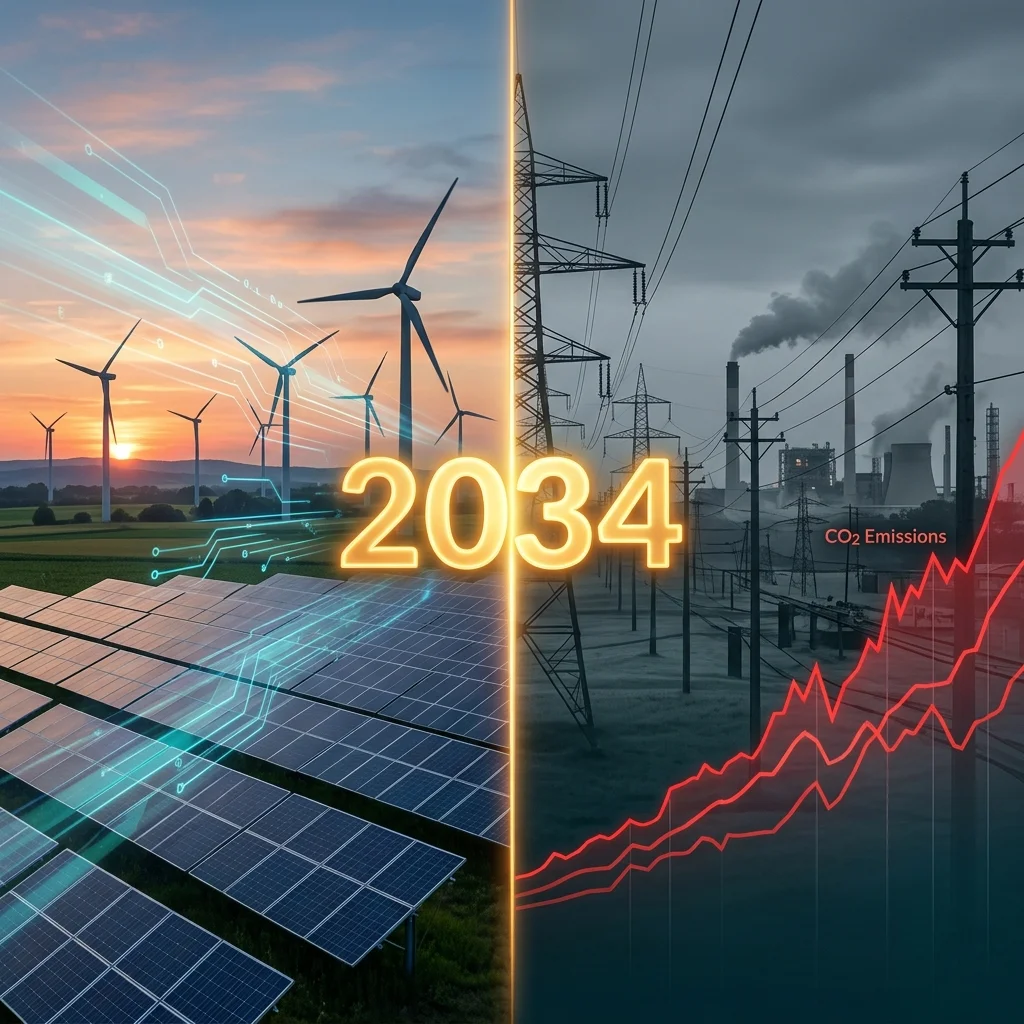
A counterintuitive dynamic underpins the renewable energy market’s expansion: rising emissions are accelerating, not retarding, the transition. Global energy-related CO2 emissions increased by 1.1% in 2023, reaching 37.4 billion tons (Gt), an absolute increase of 410 million tons (Mt) (Source 2: International Energy Agency). Greenhouse gas emissions accounted for more than 65% of this increase. This upward trajectory, occurring despite record renewable capacity additions, creates a measurable gap between current trajectory and the emissions reductions required under the Paris Agreement.
The hidden economic logic operates through policy acceleration. Each emissions data point that exceeds prior projections tightens the regulatory screws. The US IRA, the EU’s Fit for 55 package, and India’s revised renewable purchase obligations were all formulated or strengthened in response to the widening gap between ambition and reality. For investors, this creates a *forced-market expansion* dynamic: renewable energy deployment is no longer an elective environmental initiative but a mandatory compliance requirement for utilities and industrial consumers facing carbon pricing, border adjustment mechanisms, and emission trading system costs.
The critical linkage for the 2026–2034 forecast is temporal. The 2023 emissions spike serves as a lagging indicator of fossil fuel reliance, but its policy consequences—tighter renewable portfolio standards, accelerated coal phaseout schedules, expanded carbon markets—will manifest with a 2–4 year delay. This means the 2025–2028 period in the forecast window will capture the regulatory response to the 2023 data, effectively creating a self-reinforcing cycle where emissions growth seeds its own competitive replacement.
---
4. Technology as the Invisible Arbitrage: AI, Forecasting, and Grid Reliability
Market growth alone does not capture the technological transformation that is reshaping investment risk profiles. **IBM’s Renewable Energy Forecasting Platform**, a component of the IBM Environmental Intelligence Suite, now provides wind and solar forecasts with 92% accuracy (Source 3: IBM). This metric is not merely a marketing datum; it represents a functional shift in how grid operators and project financiers assess asset reliability.
For context, a five-percentage-point improvement in renewable forecasting accuracy translates directly into reduced reserve margin requirements for grid operators. Traditional gas-fired peaker plants, held in standby to compensate for solar and wind intermittency, can be dispatched less frequently, lowering operational costs and carbon footprints. For financial institutions, the 92% accuracy threshold reduces the uncertainty premium applied to renewable project finance, compressing weighted average cost of capital (WACC) by an estimated 50–80 basis points for projects utilizing such platforms.
This technological layer amplifies the value proposition of mature markets like North America and Europe, which possess the digital infrastructure to deploy advanced forecasting at scale. The bifurcation emerging is not merely between high-growth and low-growth regions but between *digitally integrated* markets where software extracts additional value from physical assets, versus *volume-driven* markets where raw capacity additions remain the primary growth metric. The former will exhibit higher profit margins per installed megawatt; the latter will dominate in total deployment volume.
---
5. Regional Divergence Zones: Where Growth Underperforms and Where It Overdelivers
Decomposing the global market reveals distinct growth regimes. North America’s projected increase from $139.00 billion (2025) to $143.97 billion (2026) implies a 3.6% growth rate—below the global inflation baseline. This is not a sign of market weakness but of *compositional shift*: the US market is transitioning from large-scale utility solar and wind installations toward hybrid projects combining solar, storage, and advanced inverters, which have longer development timelines. The slower absolute growth reflects a higher complexity quotient rather than demand deterioration.
Europe, valued at $130.06 billion in 2025, faces a similar dynamic. The EU’s offshore wind ambitions require permitting reforms and grid connection upgrades that will compress near-term capacity additions while expanding the project pipeline for 2028–2032. Latin America ($50.35 billion) and Middle East & Africa ($29.21 billion) represent the frontier: high potential driven by solar irradiance and wind resources, but constrained by currency risk, political instability, and grid infrastructure deficits.
The critical divergence to monitor is between *subsidy-driven* growth (Asia Pacific) and *market-driven* growth (North America, parts of Europe). The former is susceptible to policy reversal; the latter, while slower, exhibits greater durability and higher per-unit margins.
---
6. Supply Chain Inefficiencies as Structural Constraints
The 2026–2034 forecast period must be tempered by recognition of persistent supply chain bottlenecks. Three specific pressure points dominate:
1. **Transformer and switchgear shortages**: Global lead times for large power transformers have extended to 18–24 months, delaying interconnection of renewable projects. This is not a capacity issue but a raw material constraint: grain-oriented electrical steel, essential for transformer cores, remains in tight supply.
2. **Installation labor gaps**: The US solar industry alone requires 40,000 additional skilled electricians and installers annually to meet IRA-mandated deployment targets. Labor availability, not module supply, is becoming the binding constraint in developed markets.
3. **Shipping and logistics volatility**: While container rates have normalized from pandemic peaks, port congestion in key transit hubs (Rotterdam, Los Angeles, Singapore) introduces 4–8 week uncertainties in component delivery schedules.
These constraints will compress the realized growth rate below the theoretical CAGR, particularly in the 2026–2028 period before supply chain investments mature.
---
7. Strategic Implications: The Investor’s Nine-Year Horizon
For institutional investors and utilities, the 6.17% CAGR demands differentiated strategies based on regional exposure and technology focus. Three predictions emerge:
**First**, the technology layer (forecasting software, grid optimization AI, asset management platforms) will capture an increasing share of market value relative to hardware. The 92% accuracy benchmark set by IBM’s platform is likely to become the industry standard, creating a competitive moat for early adopters and forcing laggards into margin compression.
**Second**, the Asia Pacific–North America divide will widen in terms of *unit economics* but narrow in *total value*. Asia Pacific will continue to dominate installed capacity; North America will generate higher returns per dollar of installed capital through service integration and digital monetization.
**Third**, the 2023 CO2 emissions spike will function as a policy catalyst with measurable effects starting in 2027–2028, as carbon pricing mechanisms expand and renewable portfolio standards tighten. This will create a floor under demand that insulates the market from interest-rate sensitivity and economic cycle fluctuations.
The $1,838.57 billion target by 2034 is achievable, but only if stakeholders address the three structural constraints: supply chain diversification, permitting reform, and grid modernization. Without simultaneous progress on all three fronts, the market risks hitting a capacity ceiling that no amount of policy stimulus can overcome.
---
*Data sources: Fortune Business Insights (market size and projections), International Energy Agency (emissions data), IBM (forecasting accuracy). All market values in nominal USD unless otherwise stated. Forecast period: 2026–2034.*