Eco-Visuals

The latest news, analysis, and insights in eco-visuals.

Teal Tool: Democratizing Climate Data Visualization for a Sustainable Future
Eco Visuals

Teal Tool: Democratizing Climate Data Visualization for a Sustainable Future

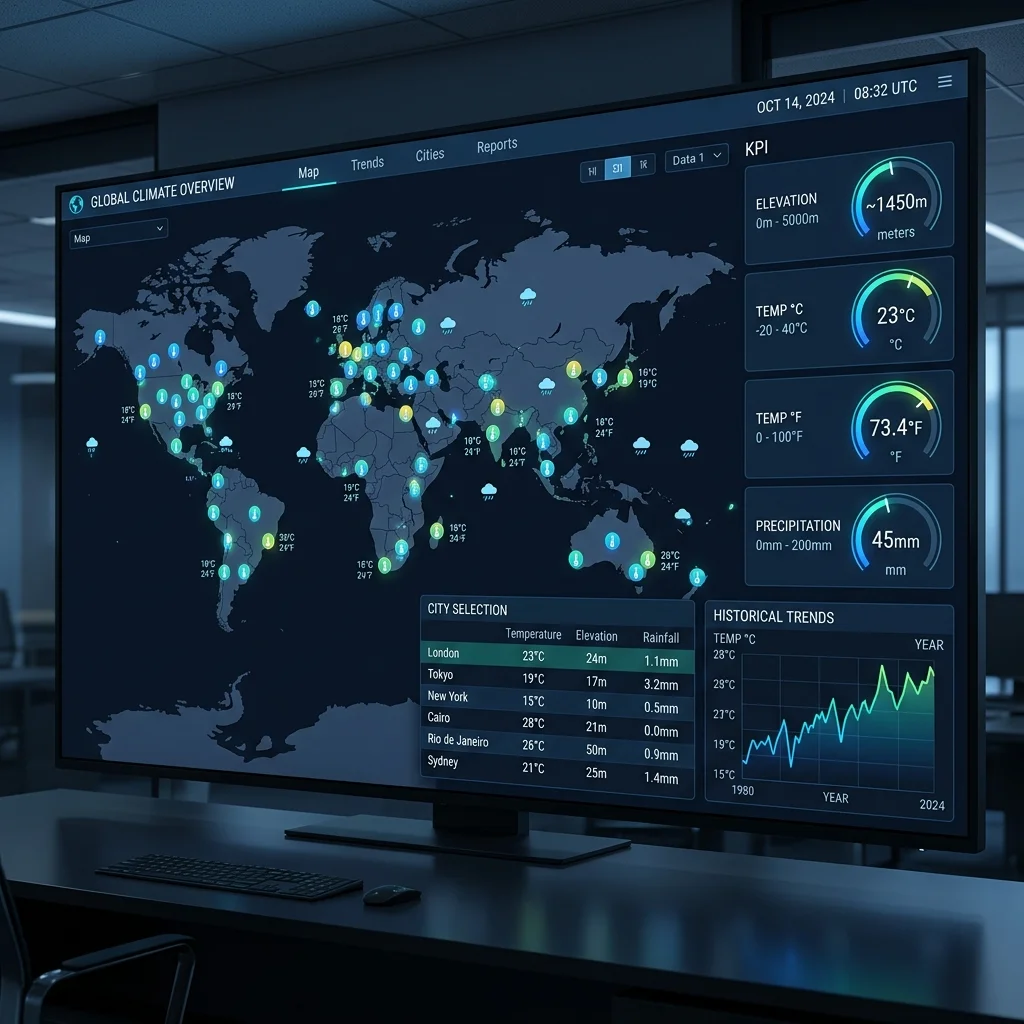
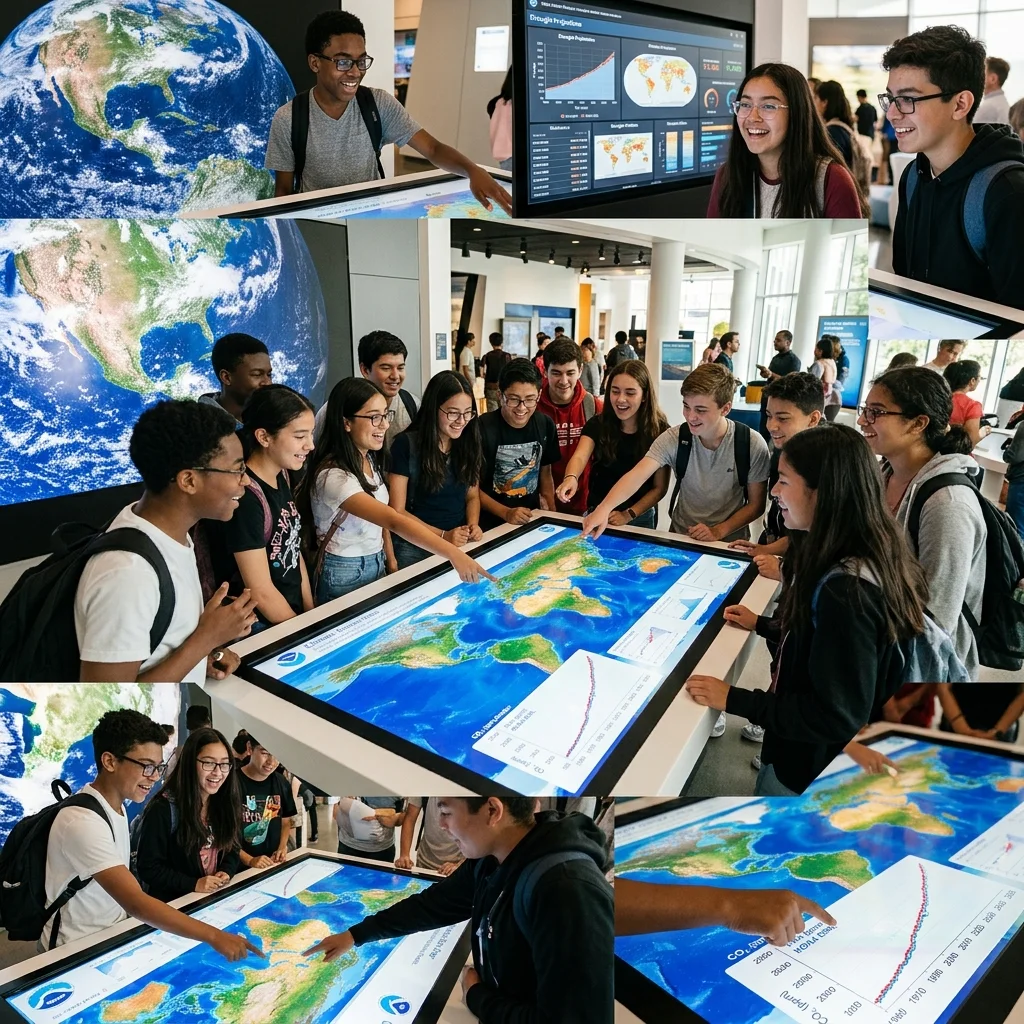
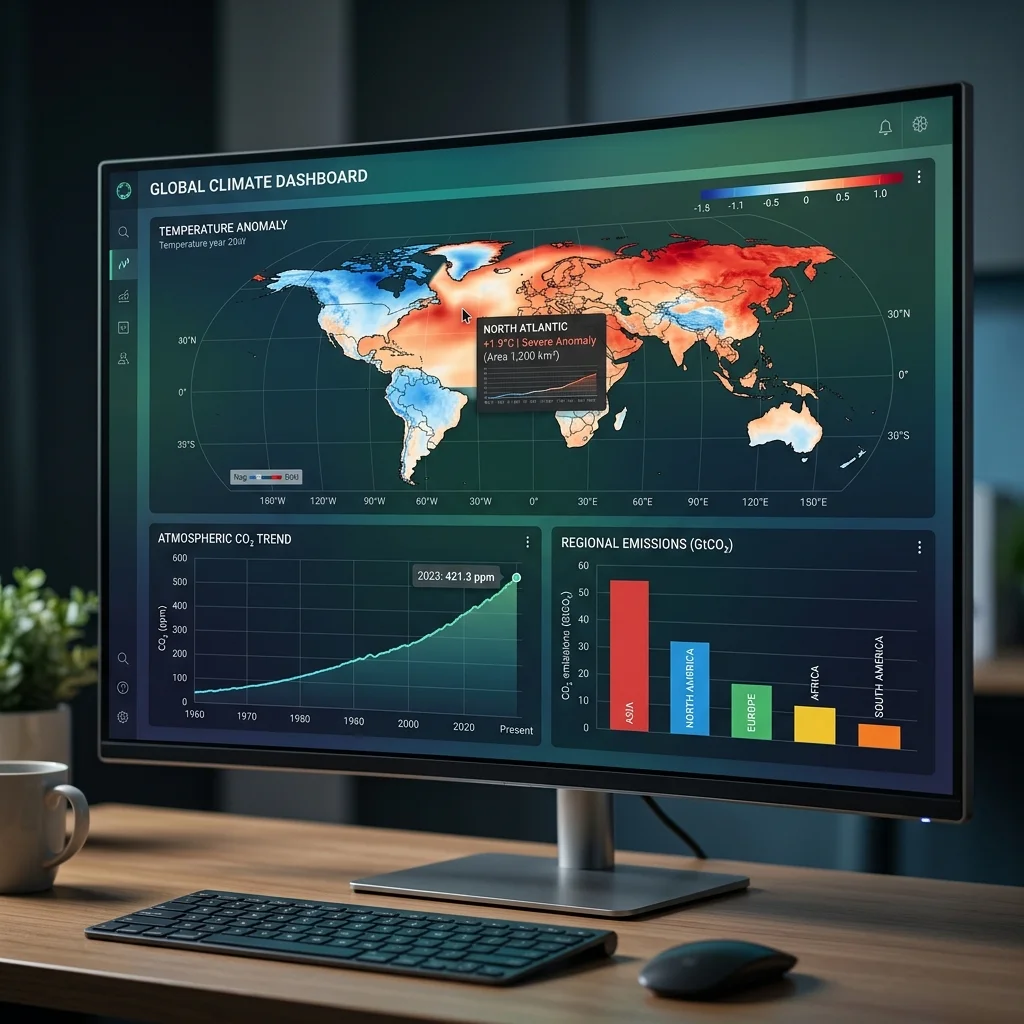
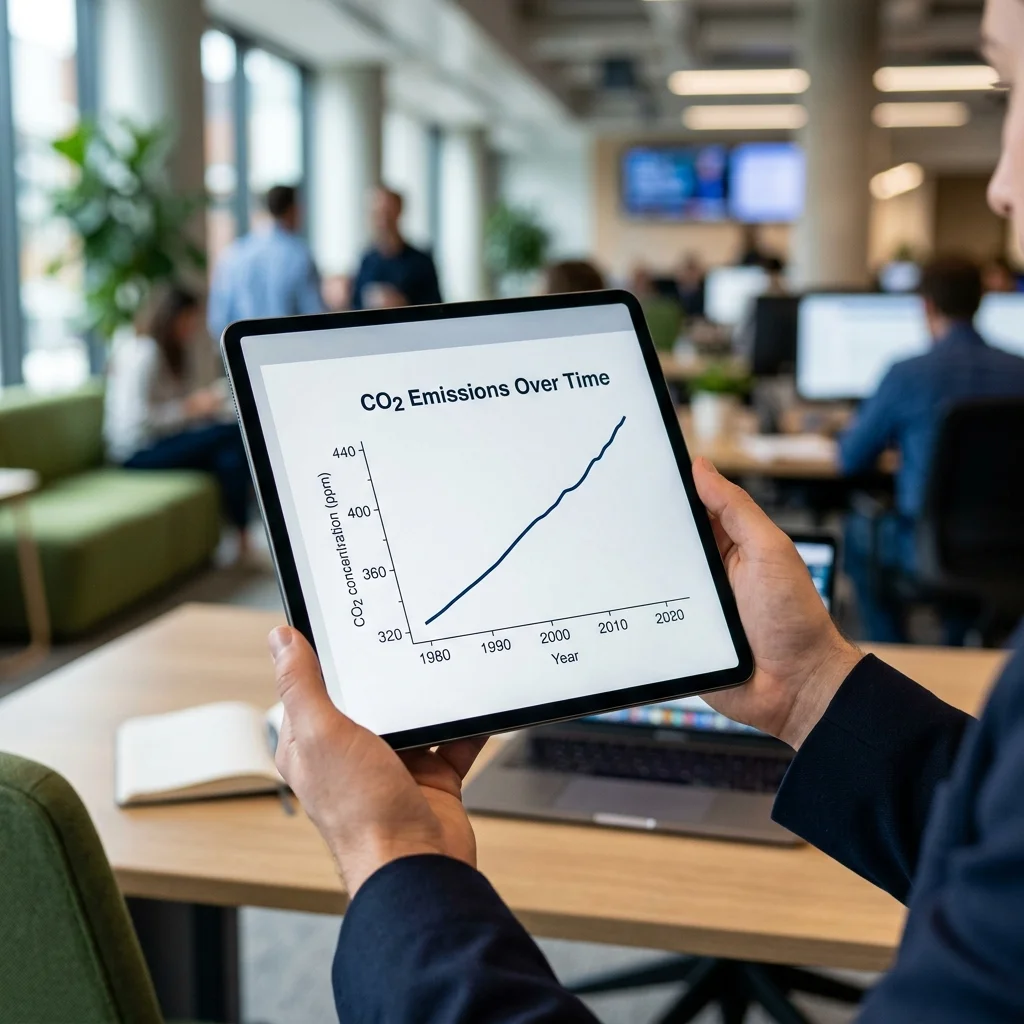
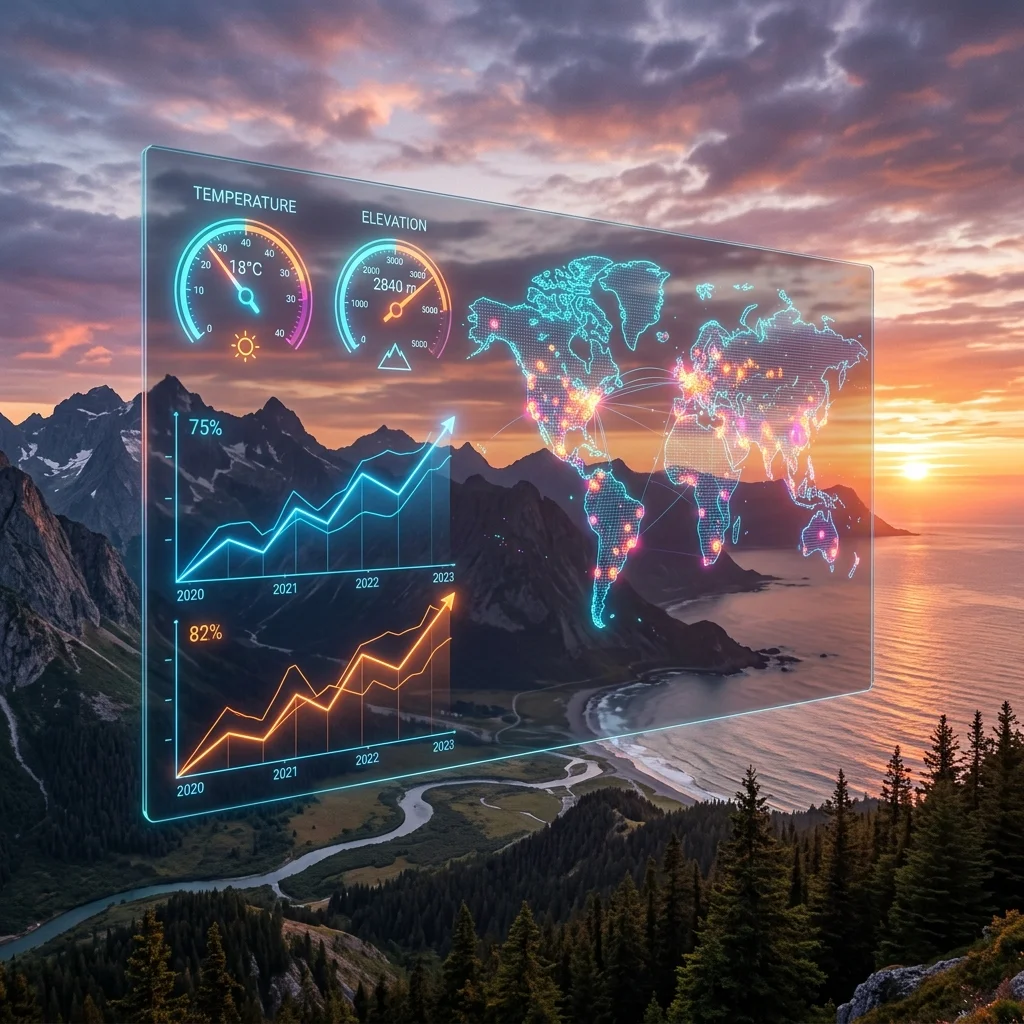
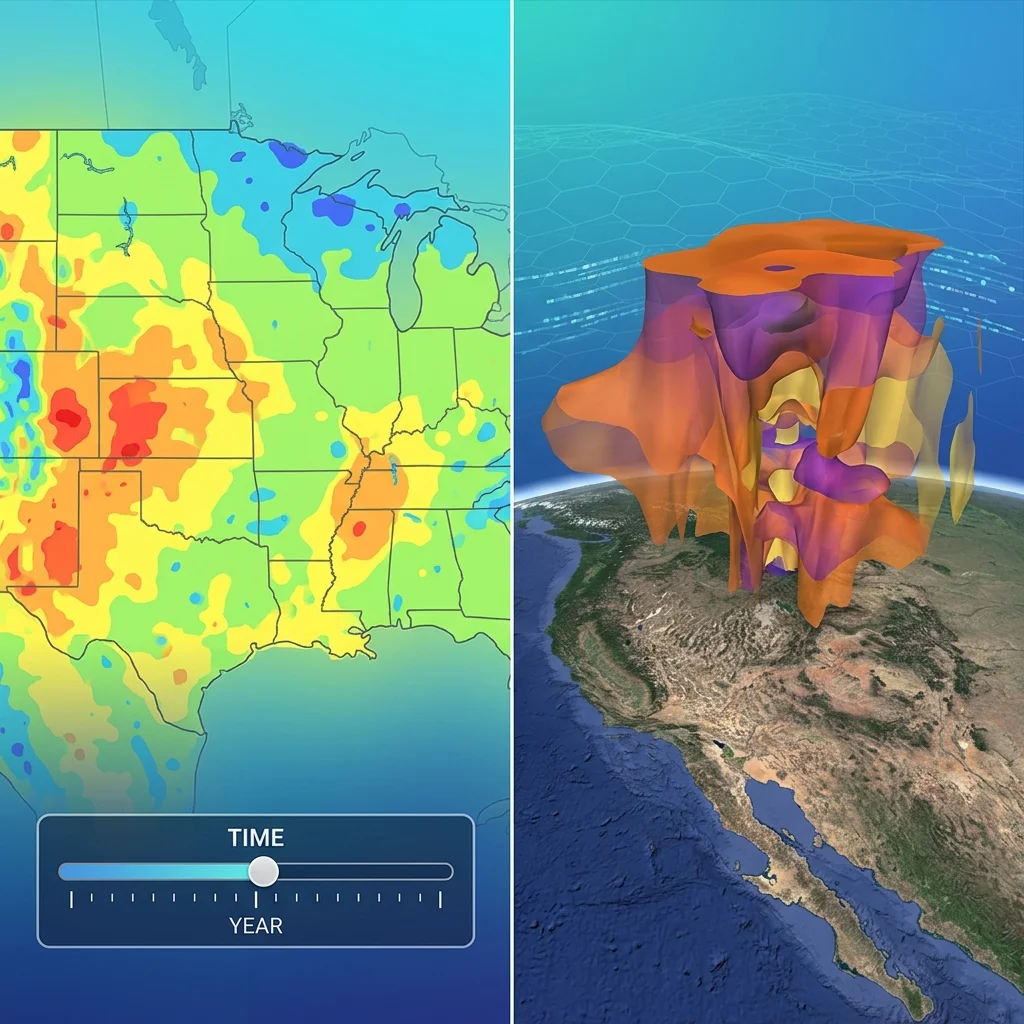
Teal is a free, interactive climate data visualization tool developed by the World Energy and Meteorology Council (WEMC) that pulls authoritative data from the European Union's Copernicus Services. Covering carbon emissions, temperature, precipitation, wind speed, and solar radiation from 1950 to near real time, Teal offers an intuitive globe map, country-specific hover data, and time-series graphs. Designed especially for youth, its simple interface removes barriers to climate intelligence, empowering students, educators, small businesses, and policymakers to make data-driven decisions. This article explores Teal's features, credibility through its Copernicus partnership, and its deeper economic impact—democratizing access to climate data and potentially disrupting traditional consulting markets. We also examine how Teal can inform supply chain risk assessments and foster a climate-literate generation.

Beyond Pretty Charts: A Data Integrity Framework for Climate Visualization
Eco Visuals

Beyond Pretty Charts: A Data Integrity Framework for Climate Visualization

A deep dive into the six essential guidelines for ethical and effective climate data visualization. Drawing on real-world examples from climate reporting, this article reveals how poor graphics can mislead audiences and misdirect resources, while clear, contextual visualizations build trust and drive informed action. We analyze the hidden costs of decorative charts and propose a quality assurance model for climate communicators.

How Highcharts Dashboards Powers Interactive Climate Data Visualization for a Sustainable Future
Eco Visuals

How Highcharts Dashboards Powers Interactive Climate Data Visualization for a Sustainable Future

Climate data visualization is critical for monitoring environmental changes and informing policy decisions. Highcharts Dashboards offers a powerful, flexible library that enables developers and non-technical users to build interactive, real-time dashboards with minimal effort. This article explores the key features—real-time updates, scalability to millions of data points, and multi-language integration—that make Highcharts an ideal choice for climate data. Through a practical example dashboard tracking global cities’ metrics (temperature, elevation, rainfall), we demonstrate how organizations can democratize climate analysis. We also examine the deeper impact: lowering barriers for NGOs, local governments, and researchers to create customized monitoring systems, ultimately accelerating data-driven climate action.

Unlocking Climate Literacy: How NOAA''s Data Resources Are Shaping the Next Generation of Decision-Makers
Eco Visuals

Unlocking Climate Literacy: How NOAA''s Data Resources Are Shaping the Next Generation of Decision-Makers

NOAA’s vast collection of climate data resources is not just a repository for scientists—it’s a strategic tool for education. This article explores the hidden economic logic behind making historical and projected climate data accessible to 5th-12th grade classrooms. By examining classroom-ready modules and interactive visualizations, we reveal how these resources are training a future workforce capable of navigating climate risks, driving adaptation innovation, and informing policy. From sea-level rise viewers to carbon dioxide trends, the data trains students to think like analysts—transforming raw numbers into actionable insights. We argue that this educational pipeline is a long-term investment in climate resilience, with ripple effects across supply chains, insurance markets, and urban planning.

Creative Climate Data Visualization: Insights from a Remote Guest Lecture at UT Austin
Eco Visuals

Creative Climate Data Visualization: Insights from a Remote Guest Lecture at UT Austin

This article explores a remote guest lecture on creative and effective climate data visualization delivered on April 1, 2026, for the GEO 371T/391 course at the University of Texas at Austin. By analyzing the lecture’s 114-slide SlideShare presentation (first 20 slides examined), we uncover how innovative visualization techniques can bridge the gap between complex climate datasets and diverse audiences. The discussion highlights the lecture’s role in advancing science communication, the shift toward remote academic engagement, and the long-term impact of such educational initiatives on climate literacy and policy-making. Practical takeaways for data scientists, educators, and communicators are included.

How NASA's Climate Spiral Visualization Redefines Climate Data Storytelling
Eco Visuals

How NASA's Climate Spiral Visualization Redefines Climate Data Storytelling

NASA's climate spiral—an animated radial plot of global temperature anomalies from 1880 to present—has become a iconic tool for communicating climate change. This article explores the science behind the GISTEMP dataset, the visual innovation popularized by Ed Hawkins, and the deeper implications of using spiral graphics to convey urgency. We examine the data pipeline, the role of public access, and how this visualization shifts public perception from abstract statistics to visceral evidence of a warming planet.

Mastering Climate Data Visualization: Techniques, Best Practices, and Tools for Impactful Communication
Eco Visuals

Mastering Climate Data Visualization: Techniques, Best Practices, and Tools for Impactful Communication

Climate data visualization transforms complex datasets into compelling stories that drive awareness and action. This article explores essential techniques—from choosing the right chart type (line charts for trends, maps for geography, bar charts for comparisons) to designing clear, interactive dashboards. Learn how to avoid common pitfalls like overloaded visuals and unclear scales, and discover how adding context (timeframes, benchmarks) and interactivity (tooltips, filters) boosts engagement. Drawing on expert insights from the Infogram Team, we provide a practical guide for anyone communicating climate science effectively.

Navigating Climate Data: Top Sources and Visualizations for Researchers and Policymakers
Eco Visuals

Navigating Climate Data: Top Sources and Visualizations for Researchers and Policymakers

Climate change data is abundant but scattered. This guide curates the most authoritative publicly-available sources for climate crisis data and visualizations, organized by Canada, global datasets, and striking visual tools. From Canada’s Climatedata.ca and Historical Climate Data to international hubs like the IPCC DDC and World Bank’s CCKP, we map the landscape. Visualizations such as #ShowYourStripes and Climate Action Venn Diagrams turn raw numbers into compelling narratives. Explore the hidden economic logic behind open climate data—how these resources empower risk assessment, policy design, and investment decisions. Last updated March 5, 2026.

Beyond the Curve: How EDHEC Climate Institute’s Data Visualization Tools Uncover Regional Economic Vulnerabilities in Climate Scenarios
Eco Visuals

Beyond the Curve: How EDHEC Climate Institute’s Data Visualization Tools Uncover Regional Economic Vulnerabilities in Climate Scenarios

EDHEC Climate Institute’s interactive data visualizations do more than map rising temperatures—they reveal a hidden economic logic: that identical global emissions pathways produce radically different regional economic impacts. This article goes beyond a tool review to explore how these visualisations can be used to audit supply chain risk, identify under-insured regions, and reshape corporate net-zero strategy. By embedding scientifically grounded projections into user-friendly dashboards, the Institute provides a slow-analysis resource for industries that need to stress-test their long-term asset portfolios against climate-driven economic shifts.

Beyond the Chart: Crafting Climate Data Visualizations That Drive Understanding
Eco Visuals

Beyond the Chart: Crafting Climate Data Visualizations That Drive Understanding

In climate reporting, a well-designed visualization can turn complex data into a clear narrative, but a poor one can confuse or mislead. This article translates the principles behind effective climate data graphics—from labeling and sourcing to historical context—into a practical framework for journalists and data storytellers. Drawing on real-world examples and expert quotes, it explains why every visual must enrich, not decorate, the story. The guide also reveals a hidden economic logic: clarity in visualization lowers the cognitive cost for audiences, increasing trust and retention. By avoiding jargon and overloading, reporters can help readers grasp long-term trends and make informed decisions about climate action.

Unlocking Climate Insights: How R Programming Transforms Data Visualization for Certification Seekers
Eco Visuals

Unlocking Climate Insights: How R Programming Transforms Data Visualization for Certification Seekers

This article examines how R programming is positioned as a key tool for climate data visualization, using the USDSI's November 2025 publication as a case study. It uncovers the economic logic of certification marketing, explores R's role in advanced climate statistics, and provides actionable insights for professionals seeking to differentiate themselves in the data science job market.

Beyond the Map: How Climate Data Portals Are Reshaping Risk Intelligence for the U.S. Economy
Eco Visuals

Beyond the Map: How Climate Data Portals Are Reshaping Risk Intelligence for the U.S. Economy

Three federal climate data portals—Climate Explorer, Climate Toolbox, and the National Climate Change Viewer—now offer downscaled CMIP5/CMIP6 projections across the contiguous U.S. While often viewed as scientific tools, this article argues they are actually the backbone of a emerging ''climate risk intelligence'' market. By analyzing their data pipelines (LOCA, MACA), update cycles (e.g., LOCA2 release in 2023), and variable coverage (from temperature to fire danger), we uncover how these portals enable a hidden economic logic: they are the critical infrastructure for insurance modeling, agricultural commodity hedging, and municipal bond ratings. This deep audit explores the slow transformation from raw climate models to actionable financial and operational risk metrics.

Beyond the Gauge: Unlocking Climate Intelligence with Highcharts Dashboards
Eco Visuals

Beyond the Gauge: Unlocking Climate Intelligence with Highcharts Dashboards

This article explores how Highcharts Dashboards transforms raw climate data into actionable intelligence. While many focus on the visual appeal of charts, we dig into the hidden economic logic: the shift from static reports to real-time, scalable decision-support systems. We analyze how features like real-time updates, drilldowns, and support for massive datasets are enabling a new era of climate analytics for cities, researchers, and policymakers. The article dissects a practical dashboard example—featuring KPI gauges, selection grids, and historical trends—to reveal how these tools bridge the gap between data complexity and strategic action, ultimately driving investment and policy in climate resilience.

From Snapshots to Projections: The Evolution of Climate Data Visualization Tools and Their Impact on Decision-Making
Eco Visuals

From Snapshots to Projections: The Evolution of Climate Data Visualization Tools and Their Impact on Decision-Making

This article explores the landscape of climate data visualization tools, from NOAA's simple Data Snapshots to the advanced Weather and Climate Toolkit. It uncovers the hidden economic logic behind the tiered difficulty of these tools, revealing a strategic segmentation that serves different user groups—from the general public to researchers and policy-makers. By examining the technology trends (such as the shift to browser-based platforms and the integration of projection data) and the market pattern of government-led tool development, the article argues that these tools represent a critical infrastructure for climate adaptation. It also highlights the long-term impact on supply chains, particularly for agriculture, insurance, and coastal real estate, and embeds verification sources from Climate.gov and NOAA.

Content Moderation in the Digital Age: Navigating the Line Between Policy and Information
Eco Visuals

Content Moderation in the Digital Age: Navigating the Line Between Policy and Information

The automated flagging of content as '[ERROR_POLITICAL_CONTENT_DETECTED]' is not merely a technical glitch but a critical node in the global information ecosystem. This article deconstructs the economic and architectural logic behind content moderation systems. We analyze how platform governance, driven by geopolitical compliance and algorithmic risk management, creates new forms of information scarcity and access patterns. Moving beyond surface-level discussions of censorship, we explore the long-term implications for supply chains of knowledge, the evolution of digital literacy, and the emerging market for 'compliance-as-a-service.' This deep audit examines the unintended consequences of automated filtering on research, global business intelligence, and the fundamental structure of the internet itself.

The Strategic Linguistics of Climate Funding: How Keywords Shape Research in a Politicized Era
Eco Visuals

The Strategic Linguistics of Climate Funding: How Keywords Shape Research in a Politicized Era

In the high-stakes arena of scientific research funding, a subtle linguistic arms race is underway. Faced with political scrutiny, climate scientists are strategically altering grant proposal language, while federal agencies like the NSF deploy specific keywords—such as ''resilience'' and ''sustainability''—to identify and funnel billions of dollars. This article analyzes the dual-track reality of modern climate science funding: a surface-level competition for resources, underpinned by a deeper, systemic dance of communication, categorization, and political navigation. We examine the scale of this system, its implications for scientific inquiry, and the long-term consequences of research being filtered through politically palatable terminology.

Beyond the Drought: Corpus Christi''s Water Crisis Exposes the Tension Between Industrial Growth and Municipal Resilience
Eco Visuals

Beyond the Drought: Corpus Christi''s Water Crisis Exposes the Tension Between Industrial Growth and Municipal Resilience

Corpus Christi's water restrictions during drought reveal more than a temporary shortage; they expose a fundamental tension in modern urban planning. As a major industrial hub, the city's economy is built on water-intensive industries, creating a paradox where economic drivers are also primary resource stressors. This analysis moves beyond surface-level reporting to examine the systemic choices that led to this vulnerability, the economic logic prioritizing industrial contracts over residential security, and the high-stakes gamble on technological solutions like desalination. Corpus Christi serves as a critical case study for cities worldwide navigating the competing demands of growth, sustainability, and resilience in an era of climate uncertainty.

The Unseen Architecture of Information Control: Decoding the ''Error'' Economy
Eco Visuals

The Unseen Architecture of Information Control: Decoding the ''Error'' Economy

This analysis moves beyond the surface-level detection of restricted content to examine the underlying systems that govern information flow. We explore the economic and technological logic behind content moderation triggers, investigating how error messages themselves have become a data point in a larger ecosystem of digital governance. The article deconstructs the infrastructure—from algorithmic classifiers to geopolitical compliance frameworks—that transforms a simple '[ERROR_POLITICAL_CONTENT_DETECTED]' into a node within a complex network of control, market adaptation, and user behavior shaping. It argues that these systems represent a new, opaque layer of the digital economy with profound implications for global supply chains, trust architectures, and the future of open information systems.

Beyond the Pivot: How Fiber Optic Soil Sensing Exposes the Hidden Inefficiency of Uniform Irrigation
Eco Visuals

Beyond the Pivot: How Fiber Optic Soil Sensing Exposes the Hidden Inefficiency of Uniform Irrigation

A University of Nebraska-Lincoln study, published in The Leading Edge, reveals a critical flaw in modern agriculture's reliance on uniform irrigation. By burying fiber optic cables to measure soil temperature at high resolution, researchers documented soil moisture varying by up to a factor of two within a single 60-acre, center-pivot irrigated field. This granular data, collected every meter and 20 minutes, challenges the economic and environmental logic of one-size-fits-all water application. The findings point toward a future of precision irrigation, where real-time, distributed soil data could dynamically guide water systems to optimize resource use, crop yield, and farm profitability, signaling a potential shift in the underlying value proposition of agricultural technology.

Beyond the Panels: How California''s Westlands Water District is Betting Its Future on a 21 GW Solar-Battery ''Crop''
Eco Visuals

Beyond the Panels: How California''s Westlands Water District is Betting Its Future on a 21 GW Solar-Battery ''Crop''

The Valley Clean Infrastructure Plan (VCIP) proposes a radical transformation of California's Westlands Water District, converting 136,000 fallowed acres into a 21-gigawatt solar and battery storage facility. More than a clean energy project, it's a strategic pivot for a region crippled by decades of water scarcity, aiming to replace lost agricultural revenue with a new, sun-harvested 'crop.' This analysis explores the hidden economic logic of repurposing water rights and land assets, the project's role as a massive grid-stabilizing battery, and the complex socio-economic trade-offs of turning the nation's fruit basket into a power plant. The plan represents a landmark case study in climate adaptation, energy infrastructure, and the future of resource-scarce agricultural economies.

Beyond Carbon-Free: Why Google''s Nebraska Data Center Test Signals a Strategic Shift in Tech''s Climate Playbook
Eco Visuals

Beyond Carbon-Free: Why Google''s Nebraska Data Center Test Signals a Strategic Shift in Tech''s Climate Playbook

Google''s exploration of a large-scale carbon capture test at its Nebraska data center is more than an environmental initiative; it''s a strategic pivot revealing the tech industry''s evolving climate calculus. This analysis moves beyond the surface-level ''green'' narrative to examine the underlying drivers: the economic and logistical limits of 24/7 renewable energy, the potential for carbon capture to become a new operational asset class, and the high-stakes race to future-proof data center viability in a carbon-constrained regulatory landscape. We dissect how this test could redefine ''carbon-free'' operations and position Google at the forefront of a nascent industrial carbon management market.

Beyond the Pipes: How Illinois'' Lead Crisis is Forging a New Blue-Collar Economy
Eco Visuals

Beyond the Pipes: How Illinois'' Lead Crisis is Forging a New Blue-Collar Economy

Illinois faces the nation''s largest challenge with over 1 million lead service lines. While the $1.5 billion in federal funding tackles the public health emergency, a more profound economic transformation is underway. This article explores how the crisis is catalyzing a dual-track investment: not just in infrastructure, but in a next-generation skilled workforce. Through multi-million dollar training grants, paid apprenticeships, and public-private partnerships, Illinois is leveraging an environmental mandate to address systemic labor shortages, create sustainable career pathways, and potentially establish a national model for turning infrastructure burdens into economic opportunities.

The Mycelium Revolution: How Fungi''s Hidden Networks Are Reshaping Conservation and Science
Eco Visuals

The Mycelium Revolution: How Fungi''s Hidden Networks Are Reshaping Conservation and Science

Long relegated to the sidelines of biology, fungi are now at the center of a scientific and conservation paradigm shift. This article explores how the recognition of fungi's critical ecological roles—from forming vast underground nutrient networks to driving decomposition—is catalyzing a new era of research and policy. We examine the emerging 'fungal infrastructure' as a key asset for ecosystem resilience, analyzing the recent surge in institutional initiatives like the IUCN's conservation committee and global mapping projects. The piece argues that this represents not just a biological discovery, but a fundamental rethinking of how we value, map, and protect the foundational systems of life on Earth.

Beyond Flight Shame: The Psychology of Personal Carbon Budgeting in a Travel-Obsessed World
Eco Visuals

Beyond Flight Shame: The Psychology of Personal Carbon Budgeting in a Travel-Obsessed World

This article moves beyond the surface-level debate of ''flight shame'' to explore the emerging psychological framework of personal carbon budgeting. Through the lens of a climate-aware therapist''s advice, we examine how individuals are internalizing systemic climate challenges, turning abstract emissions data into a personal ledger. The analysis reveals a deeper trend: the individualization of corporate and governmental climate responsibility, and the rise of ''carbon accounting'' as a new form of emotional labor. We investigate the long-term implications of this psychological shift for consumer behavior, the travel industry''s supply chain, and the potential for collective action versus personal burnout.

The Melting Business: How Iceland''s Glacier Tourism Industry Is Adapting to Climate Change
Eco Visuals

The Melting Business: How Iceland''s Glacier Tourism Industry Is Adapting to Climate Change

Iceland's iconic glaciers, covering 10% of the country, are receding at an alarming rate, losing 250 cubic kilometers of ice in 25 years. Yet, glacier tourism is booming, with over 2.3 million visitors to Vatnajökull National Park in 2023. This article explores the paradoxical relationship between a climate-threatened natural resource and a growing industry. We analyze how operators are forced to adapt—constantly moving tour starting points, deploying crevasse radar for safety, and following new government guidelines—while the very attraction they sell disappears. The piece uncovers the hidden economic logic of a tourism sector built on a vanishing foundation and its long-term viability.

The AI Power Paradox: How a Pennsylvania Town''s 1.5-Gigawatt Data Center Exposes the Hidden Costs of the AI Boom
Eco Visuals

The AI Power Paradox: How a Pennsylvania Town''s 1.5-Gigawatt Data Center Exposes the Hidden Costs of the AI Boom

The approval of a massive 2.5 million square foot AI data center campus in West Whiteland Township, Pennsylvania, reveals a critical tension at the heart of the artificial intelligence revolution. While promising economic development, the project's staggering demand for 1.5 gigawatts of power—more than San Francisco—and its reliance on Susquehanna River water for cooling have ignited local controversy and a lawsuit. This case study serves as a microcosm of the broader, often overlooked, infrastructural and environmental burdens placed on small communities by the global race for AI supremacy, questioning the sustainability of current development models.

The $4 Gallon Tipping Point: How Gas Prices Trigger the EV Consideration Switch
Eco Visuals

The $4 Gallon Tipping Point: How Gas Prices Trigger the EV Consideration Switch

A landmark 2022 MIT Energy Initiative analysis reveals a precise economic trigger for mass EV consideration: the $4 per gallon gasoline threshold. By correlating Google search data with vehicle registrations from 2017-2022, the study quantifies a behavioral tipping point. When prices breach this level, EV searches surge by 41% and registrations rise 17% within two months. This article explores the hidden price elasticity of consumer energy decisions, questions the permanence of this demand shift, and examines what this predictable trigger means for automakers, policymakers, and the energy transition. It moves beyond observing a correlation to dissecting the underlying market psychology and long-term strategic implications.

Beyond Greenwashing: How Oil Giants Are Pivoting to Strategic Climate Funding and Core Business Defense
Eco Visuals

Beyond Greenwashing: How Oil Giants Are Pivoting to Strategic Climate Funding and Core Business Defense

Major oil companies are executing a significant strategic shift in their approach to climate change. Moving past the era of broad ''greenwashing'' campaigns, they are now channeling funds into specific, high-tech climate solutions like direct air capture that align with their fossil fuel infrastructure and expertise. Concurrently, public-facing climate pledges are being scaled back, revealing a dual-track strategy: investing in long-term, business-compatible technologies while defending core oil and gas operations in the short to medium term. This analysis explores the underlying economic logic of this pivot and its implications for the energy transition.

The Great Retreat: How Climate Risk is Reshaping the U.S. Insurance Market
Eco Visuals

The Great Retreat: How Climate Risk is Reshaping the U.S. Insurance Market

The U.S. insurance market is undergoing a fundamental, climate-driven realignment. As premiums skyrocket and major insurers retreat from high-risk states like California and Florida, a new economic reality is emerging. This article analyzes the data behind the crisis, exploring the dual trends of rising consumer costs and corporate withdrawal. It examines the long-term consequences for housing markets, regional economies, and financial stability, arguing that the insurance industry's retreat is not a temporary correction but a permanent restructuring of risk distribution in America.

Guam v. United States: How a Supreme Court Case Could Redefine Environmental Justice and Federal Accountability
Eco Visuals

Guam v. United States: How a Supreme Court Case Could Redefine Environmental Justice and Federal Accountability

The U.S. Supreme Court case *Guam v. United States* is more than a dispute over $160 million in cleanup costs for the toxic Ordot Dump. It represents a critical test of federal accountability for environmental damage on Indigenous lands and a potential shift in how the costs of military legacy pollution are allocated. This analysis explores the case's hidden economic logic—where statutes of limitations become a tool for fiscal evasion—and its profound implications for environmental justice, the remediation of CHamoru ancestral lands, and the future of cost-recovery for federally-caused contamination nationwide. The outcome could set a precedent that either strengthens or undermines the polluter-pays principle for government agencies.

Beyond the Melt: The Hidden Economic and Scientific Value of Europe''s Disappearing Glacier Archives
Eco Visuals

Beyond the Melt: The Hidden Economic and Scientific Value of Europe''s Disappearing Glacier Archives

As European Alpine glaciers vanish, a frantic scientific race is underway to extract their ice cores—not merely for climate history, but as irreplaceable raw data for future technologies and economic models. This article argues that these ice archives represent a new class of non-renewable intellectual property, crucial for calibrating next-generation climate models, validating satellite data, and underpinning trillion-dollar risk assessments for industries from insurance to agriculture. The storage of these cores in remote vaults like the Ice Memory Foundation's Antarctic facility transforms them from research samples into strategic assets, raising questions about data sovereignty, long-term access, and who benefits from the predictive power locked within ancient ice.

Hornwort''s Ancient Blueprint: How a 400-Million-Year-Old Plant Could Revolutionize Sustainable Agriculture
Eco Visuals

Hornwort''s Ancient Blueprint: How a 400-Million-Year-Old Plant Could Revolutionize Sustainable Agriculture

Research into the humble hornwort, one of Earth''s oldest land plants, is uncovering a genetic toolkit for drought tolerance and natural nitrogen fixation. Scientists from the Boyce Thompson Institute and Cornell University are decoding its symbiotic relationship with cyanobacteria, a partnership that allows it to pull nitrogen from the air. This deep biological audit reveals a potential paradigm shift: transferring these traits to major crops could drastically reduce the global agricultural industry''s dependency on energy-intensive synthetic fertilizers. The implications extend beyond farm economics to reshaping the environmental and geopolitical landscape of food production.

Content Filtering in the Digital Age: Understanding Error Codes and Information Access
Eco Visuals

Content Filtering in the Digital Age: Understanding Error Codes and Information Access

The appearance of standardized error codes like '[ERROR_POLITICAL_CONTENT_DETECTED]' represents a critical inflection point in digital information ecosystems. This article moves beyond surface-level discussions of censorship to analyze the architectural and economic logic behind automated content moderation systems. We examine how such error messages function as data points within larger frameworks of platform governance, algorithmic transparency, and geopolitical digital strategy. The analysis explores the long-term implications for global supply chains of information, the normalization of automated gatekeeping, and the emerging market for 'compliance-by-design' technologies. By deconstructing this single error, we uncover the hidden infrastructures that increasingly dictate the boundaries of accessible knowledge in interconnected digital markets.

The Green Rush Paradox: How Critical Minerals Mining Undermines Amazon Land Reform
Eco Visuals

The Green Rush Paradox: How Critical Minerals Mining Undermines Amazon Land Reform

A new mining rush for critical minerals, driven by the global green energy transition, is creating a profound paradox in the Brazilian Amazon. While these minerals are essential for decarbonization, their extraction is directly threatening the stability and sustainability of land reform settlements—key areas for agrarian reform and forest conservation. This article explores the hidden economic logic of this conflict, where the demand for 'green' commodities is fueling deforestation and land tenure insecurity. It examines the pressure from overlapping mining claims, the long-term implications for local communities and global supply chains, and why this clash represents a critical fault line in sustainable development.

Beyond Protection: Why Species Recovery is Slowing and What It Means for Conservation Economics
Eco Visuals

Beyond Protection: Why Species Recovery is Slowing and What It Means for Conservation Economics

A landmark study in Nature reveals a troubling trend: the rate of recovery for species and ecosystems has sharply declined since the 1990s, from 5% to just 1% per year. This slowdown, uncovered by researchers from iDiv and Martin Luther University, signals a critical inflection point for global conservation. The analysis of nearly 3,000 time series suggests that simple protection is no longer sufficient. The increasing complexity of threats and restoration efforts demands a fundamental shift toward more active, sophisticated, and economically integrated interventions. This article explores the hidden economic logic behind the slowdown and its implications for the future of biodiversity investment.

Beyond IPCC Projections: Why New Climate Sensitivity Data Signals a Faster, More Disruptive Warming Era
Eco Visuals

Beyond IPCC Projections: Why New Climate Sensitivity Data Signals a Faster, More Disruptive Warming Era

A landmark 2023 study published in Nature Reviews Earth & Environment reveals a critical recalibration of Earth''s climate sensitivity, suggesting it is significantly higher than the IPCC''s established range. This analysis, led by institutions like the University of Leeds and the Met Office Hadley Centre, indicates a ''likely'' warming range of 3.1°C to 4.1°C per doubling of CO2, up from 2.5°C to 4°C. The practical consequence is stark: a 50% probability of breaching the 1.5°C threshold by 2029, years ahead of previous IPCC estimates. This article explores the hidden economic and systemic implications of this accelerated timeline, arguing it represents not just a scientific update but a fundamental shift in risk assessment for global infrastructure, finance, and adaptation planning.

Beyond the Check: The Systemic Delays and Economic Ripple Effects of Georgia''s Hurricane Helene Farm Relief
Eco Visuals

Beyond the Check: The Systemic Delays and Economic Ripple Effects of Georgia''s Hurricane Helene Farm Relief

While Georgia farmers have finally begun receiving federal disaster payments in early 2025 for Hurricane Helene''s September 2024 devastation, the months-long delay reveals a critical vulnerability in the U.S. agricultural safety net. This analysis moves beyond the headline of a $1.5 billion USDA allocation to examine the hidden economic logic of disaster relief: how bureaucratic timelines directly impact farm solvency, local economies, and future planting decisions. We explore why the gap between disaster declaration and fund distribution is a predictable, yet often unaddressed, systemic flaw, and what the delayed cash infusion means for Georgia''s agricultural supply chain and credit markets in the coming year.

Beyond the Ballot: How Ann Arbor''s Public Energy Utility Redefines Urban Power Economics
Eco Visuals

Beyond the Ballot: How Ann Arbor''s Public Energy Utility Redefines Urban Power Economics

Ann Arbor, Michigan's voter-approved Sustainable Energy Utility (SEU) represents a radical departure from traditional utility models. By creating a city-run entity to install and maintain solar and battery systems for opt-in residents, it directly tackles energy poverty while accelerating decarbonization. This analysis explores the hidden economic logic of the SEU, examining its potential to disrupt the private utility monopoly, its innovative financing that separates infrastructure ownership from energy consumption, and its targeted pilot in the high-burden Bryant neighborhood as a blueprint for equitable climate action. The model, validated by University of Michigan research, offers a scalable template for cities aiming to regain local control over their energy future.