Beyond Pretty Charts: A Data Integrity Framework for Climate Visualization
A deep dive into the six essential guidelines for ethical and effective climate data visualization. Drawing on real-world examples from climate reporting, this article reveals how poor graphics can mislead audiences and misdirect resources, while clear, contextual visualizations build trust and drive informed action. We analyze the hidden costs of decorative charts and propose a quality assurance model for climate communicators.
Beyond Pretty Charts: A Data Integrity Framework for Climate Visualization
Introduction: The Hidden Cost of Decorative Data
In the rush to make climate data engaging, many organizations have fallen into a trap: treating charts as decoration rather than as tools for insight. A flashy infographic with glowing colors and 3D effects may look impressive on a slide deck, but if it obscures the underlying numbers, it can lead to costly misallocations of resources. Consider the billions of dollars flowing into green investments each year—venture capital, government subsidies, corporate sustainability budgets. When decision-makers rely on misleading or poorly designed visualizations, they risk funding the wrong technologies, ignoring critical trends, or underestimating risks.
A 2023 study published in *Reporting with Numbers* outlined six essential guidelines for ethical and effective data visualization in climate communication. These guidelines are not merely aesthetic preferences; they are a quality assurance framework that can mean the difference between informed action and dangerous confusion. Below, we walk through each guideline, drawing on real-world examples from climate reporting to show what goes wrong—and what goes right.
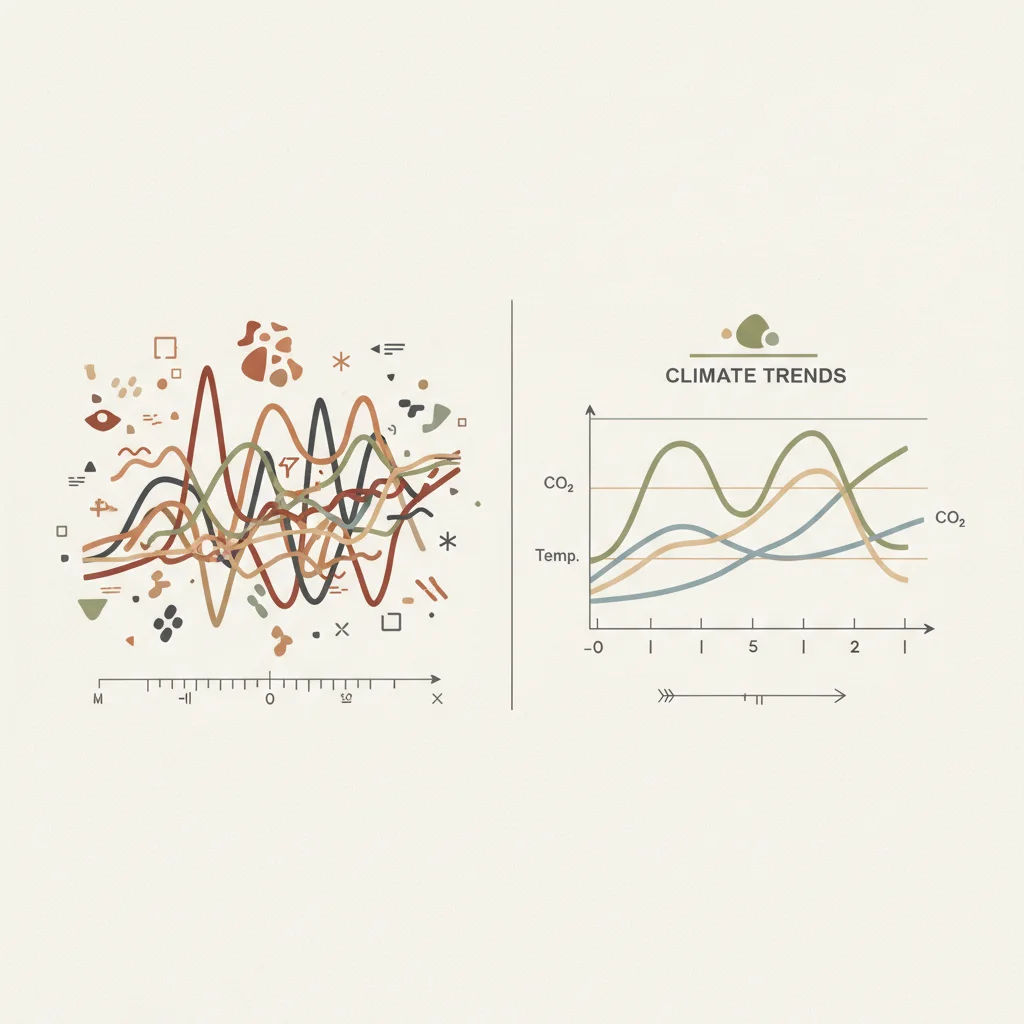
[IMAGE: Side-by-side comparison of a cluttered chart (multiple overlapping lines, missing labels, distracting 3D effects) and a clean chart (clear axes, concise title, single time series, subtle color palette). No text; abstract representation of chaos versus clarity.]
Guideline 1: Substance Over Decoration – The StartUsInsights Cautionary Tale
A widely circulated graphic from StartUsInsights titled “Top 10 Renewable Energy Trends” provides a textbook example of decoration trumping substance. The chart uses a radial bullseye layout with concentric rings, each ring representing a different trend, but the scaling is inconsistent: one trend appears to occupy twice the physical space of another even though the underlying metrics are not directly comparable. The legend is buried in a corner, the units are missing, and the color gradient has no logical relationship to the data. A reader scanning the graphic might walk away thinking “solar is the biggest trend” without understanding whether that judgment is based on investment, capacity, patents, or media mentions—because the chart never says.
The problem is not that the graphic is ugly; it is that it actively misleads. Climate data visualization must prioritize **enrichment** over **embellishment**. Enrichment means adding layers of meaning—annotations, contextual benchmarks, uncertainty ranges—that help the reader interpret the numbers correctly. Embellishment adds visual flair that distracts or confuses. The StartUsInsights chart is all embellishment and no enrichment.
[IMAGE: Mockup of a decorative radial bullseye chart (fake data, no axis labels, rainbow colors) next to a simple bar chart showing the same data with clear labels and footnotes. Caption: "Decorative vs. informative: which one helps you make a funding decision?"]
Guideline 2: The Basics – Titles, Labels, and Citations as Trust Anchors
If you cannot trust a chart’s basic anatomy, you cannot trust its conclusions. One of the most common failures in climate reporting is the **missing title and axis label** problem. A temperature anomaly graph covering the 1950s to present, published without a title or labeled axes, forces the reader to guess what is being measured. Is it global average temperature? Regional? Sea surface? Monthly or annual? Without that context, the chart is useless—or worse, can be misinterpreted.
Consider the “DON’T DO THIS” example from the 2023 guidelines: a line graph showing rising red bars from 1950 to 2020, with no title, no y-axis unit, and no source citation. A casual observer might assume it shows carbon emissions, but it actually shows a different metric altogether. The lack of labels erodes credibility because the audience cannot fact-check the claim.
The “DO THIS” version of the same data includes: a clear title (“Global Land-Ocean Temperature Anomaly, 1951–2020, Relative to 1951–1980 Baseline”), labeled y-axis (“Temperature Anomaly (°C)”), labeled x-axis (“Year”), and a footnote with the data source (“NASA GISS Surface Temperature Analysis”). This simple transparency builds trust. Climate data visualization is, at its core, an act of science communication; omitting basic metadata is akin to publishing a scientific paper without a methods section.
[IMAGE: Two line graphs of temperature anomalies. Left: no title, no axis labels, no source. Right: same data with clear title, labeled axes, and a "Source: NASA GISS" citation. Arrow pointing from left to right with text "Trust Anchors".]
Guideline 3: Accessible Language in Titles and Captions – From Jargon to Insight
Climate scientists frequently use shorthand acronyms and model identifiers that mean nothing to policymakers, journalists, or the general public. A map titled “Change in DJF TMEAN, RCP45, 2041-2060 minus 1981-2010” is technically accurate but communicationally dysfunctional. What does “DJF” mean? December, January, February—the boreal winter. “TMEAN” is mean temperature. “RCP45” is a specific emissions pathway. To a climate modeler, this is second nature. To a city planner deciding where to allocate flood defenses, it is noise.
The alternative is a title like “Spring is arriving early in the Southeast and late in the Southwest.” This phrasing is not dumbing down the science; it is translating it. The underlying data remains the same, but the framing makes the insight immediately actionable. A farmer in Georgia sees “spring arriving early” and can adjust planting schedules. A water manager in Arizona sees “late spring” and can prepare for extended drought.
Accessible language does not mean removing nuance. It means replacing technical jargon with plain-English explanations that preserve the core finding. Climate data visualization guidelines consistently emphasize that the title should answer the question “What does this mean for me?” before the reader even looks at the axes.
[IMAGE: Two maps side by side. Left: map with title "Change in DJF TMEAN, RCP45, 2041-2060 minus 1981-2010" and a confusing color scale. Right: same map but with title "Spring is arriving early in the Southeast and late in the Southwest" and a clear red-blue color scale with "Earlier" and "Later" labels.]
Guideline 4: Clear Captions, Legends, and Footnotes – Explaining the Unexplained
Even well-designed charts can fail if the supporting text is absent or ambiguous. A graph showing “polluted waterways” across U.S. states might have a legend indicating blue for “low pollution” and red for “high pollution,” but if the caption does not define what “low” and “high” mean in parts per billion, or what pollutants are included, the reader has no way to interpret severity.
The 2023 guidelines highlight a case where a bar chart of water quality measurements omitted the unit of measurement entirely. Was it micrograms per liter? Milligrams? The caption read “Pollutant concentrations over time,” which could mean anything. The graph eventually appeared in a policy brief that recommended funding for wastewater treatment plants—but without knowing the actual concentrations, policymakers could not assess whether the problem was urgent or moderate.
Best practices for captions and footnotes in climate visualization include: - Always define the unit of measurement in the axis label or caption. - If data is normalized or indexed, explain the baseline. - For modeled data, state the model name and scenario (e.g., “CMIP6, SSP2-4.5”). - Include uncertainty ranges (error bars, shading) and explain what they represent. - Provide a direct link or citation to the raw data.
Leaving ambiguity in captions is not a minor oversight; it is an integrity failure that can derail climate action.
[IMAGE: Diagram of a bar chart with annotations: callout boxes pointing to "Correct unit label (µg/L)", "Footnote with data source and methodology", "Legend defining color categories", and "Caption describing the time period and geographic scope".]
Guideline 5: Simplicity in Complexity – Solar Geoengineering Scenarios
When a topic is inherently complex, the temptation is to cram everything into one graphic. Solar geoengineering—deliberately reflecting sunlight to cool the planet—is a high-stakes, controversial subject. A clear visualization of different deployment scenarios can help the public and policymakers understand trade-offs. But the 2023 guidelines show two contrasting attempts: a successful three-scenario graphic versus a confusing four-scenario version from the World Meteorological Organization (WMO).
The clear graphic uses three panels, each with a single line showing global average temperature under a different geoengineering assumption: no intervention, moderate intervention starting in 2030, and aggressive intervention starting in 2050. Each panel has a consistent y-axis scale, a legend that matches the line colors, and a short caption explaining what each scenario represents.
The WMO version attempted to show four scenarios on a single chart, with overlapping shaded uncertainty ranges, dashed lines, and a legend that required a magnifying glass to read. The result was visual overload. Readers could not tell which line corresponded to which scenario, and the uncertainty shading made the trends appear to converge even though the underlying differences were significant.
The lesson for science communication: when complexity is unavoidable, break it into digestible pieces. One chart per key comparison is better than one chart that tries to do everything. Climate data visualization guidelines recommend the "one story per chart" rule—especially for high-stakes topics where misinterpretation could influence public policy.
[IMAGE: Simplified infographic with three separate line charts (panels) for solar geoengineering scenarios: "No Intervention", "Moderate (2030 start)", "Aggressive (2050 start)". Each panel has a clear title, labeled axes, and a single line. Below, a small note: "Each scenario shown in its own panel for clarity."]
Guideline 6: Historical Context – The Ozone Days Case
Data without history is misleading. A graph showing "high ozone days" in a single year might look alarming or reassuring, depending on the baseline. The 2023 guidelines present an example from air quality reporting: a chart of high ozone days in 2022 that was labeled "not off-the-charts high." Without historical context, that statement is meaningless. Is 2022 high compared to last year? Compared to the 1970s? Compared to the Clean Air Act baseline?
The corrected version of the chart showed the number of high ozone days going back to the mid-1990s. With that context, it became clear that while 2022 was not an all-time record, it was still significantly elevated compared to the long-term average—and the trend was rising after a period of improvement. The "not off-the-charts" framing was technically true but deeply misleading because it omitted the upward trajectory.
Historical context is especially critical for climate data because natural variability can obscure long-term trends in short windows. A cold winter in a warming world does not disprove climate change; it is a blip. But a chart that shows only that winter without the 30-year trend invites misinterpretation. Climate visualization guidelines recommend always including a historical baseline (at least 30 years for climate data) and using annotations to highlight significant events (e.g., El Niño years, policy changes, volcanic eruptions).
[IMAGE: Two versions of a line chart showing "High Ozone Days per Year". Left: only the year 2022, with a flat line labeled "Not off-the-charts high". Right: same data but extending back to 1995, showing the upward trend in recent years. A red arrow points to the 2022 value and a note says "Context reveals rising trend despite single-year comparison."]
Conclusion: From Decoration to Decision-Making
The six guidelines discussed above are not abstract ideals—they are practical tools for anyone who communicates climate data. From journalists to NGO analysts to corporate sustainability officers, the goal should be to turn numbers into decisions, not decorations. A well-designed chart can save millions of dollars by directing investments to the right solutions; a misleading chart can waste them.
Climate data visualization is a form of science communication that carries ethical weight. When we present data without context, without accessible language, or without clear sources, we are not just making a design mistake—we are contributing to the very confusion that hampers effective climate action. The framework outlined here—substance over decoration, basic labels as trust anchors, accessible language, clear captions, simplicity in complexity, and historical context—provides a roadmap for regaining that trust.
The next time you see a climate chart, ask yourself: does this help me understand, or does it just look pretty? The answer may determine where the next billion dollars goes.