Cover Story

Policy Mixes for Sustainability Transitions: A Deep Framework for Analyzing Energy Transition Policy Design

This article examines how policy mixes shape sustainability transitions, using Rogge and Reichardt’s interdisciplinary framework to explain policy design beyond single instruments. The core logic is that technological change, market formation, and institutional coordination must be aligned through a mix of policy elements, policy processes, and policy characteristics. The piece focuses on the German energy transition as a practical test case, showing why renewable power adoption depends not only on incentives, but on timing, coherence, stability, and interaction across policies. Best suited for slow analysis, this topic supports a deep audit of sustainability policy analysis, with emphasis on long-term system change rather than short-term policy headlines.

12 min readJune 8, 2026
Policy Mixes for Sustainability Transitions: A Deep Framework for Analyzing Energy Transition Policy Design
NextGen Power Corp. (NXT)
AA
ESG Performance Overview
Environment85 / 100
Social92 / 100
Governance78 / 100
Global Energy Snapshot
Q3 2024 vs Q2 2024
Global Solar Capacity
12.5%

1280.5 GW

Global Wind Capacity
8.2%

906.3 GW

Carbon Price Tracker
EU ETS Market

Current Price

85.32€/ton
24h Change
-1.25%
Trading Volume1.2M tons

Power & Energy

Renewable Energy Markets in 2025: Investment Boom, Grid Bottlenecks, and the Race to 2030
Power Energy

Renewable Energy Markets in 2025: Investment Boom, Grid Bottlenecks, and the Race to 2030

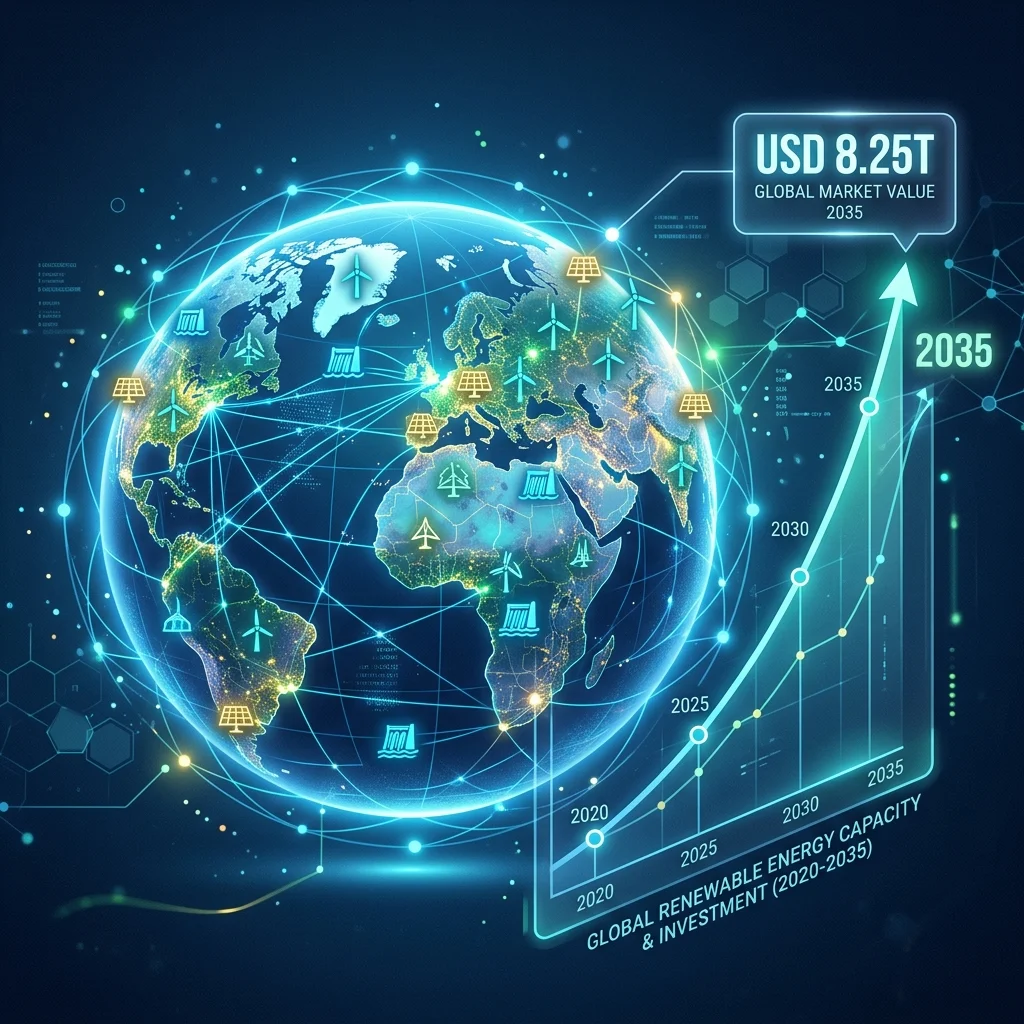
Renewable energy is no longer a niche transition story—it is a large-scale market reshaping electricity supply, capital flows, and industrial supply chains. Nearly 30% of global electricity now comes from renewables, up from 20% in 2011, while clean energy investment hit $2.1 trillion in 2024. Yet the market is not scaling smoothly: supply chain imbalances, permitting delays, aging grids, and policy uncertainty are becoming the main constraints on growth. This article will examine the hidden economic logic behind the renewables boom, including why solar and wind are winning on cost, where bottlenecks are shifting from generation to infrastructure, and how the race to 2030 may determine whether net-zero goals remain credible.

Renewable Energy Markets: The Hidden Supply Chain Logic Shaping the Next Growth Cycle
Power Energy

Renewable Energy Markets: The Hidden Supply Chain Logic Shaping the Next Growth Cycle

This article will frame renewable energy markets through the deeper economic and supply-chain logic behind pricing, deployment, and industrial scaling. Rather than focusing only on short-term policy headlines, it will examine how manufacturing bottlenecks, critical minerals, grid infrastructure, financing conditions, and technology learning curves determine market outcomes. The piece is best suited to a slow-analysis approach, since the most valuable insight comes from tracing durable industry patterns instead of reacting to temporary news flow. Verification will be embedded where claims about capacity, costs, and market shares are discussed, using credible industry and government sources to separate structural trends from cyclical noise.

Renewable Energy Market Forecast 2026-2035: The Trillion-Dollar Transition and Hidden Supply Chain Shifts
Power Energy

Renewable Energy Market Forecast 2026-2035: The Trillion-Dollar Transition and Hidden Supply Chain Shifts

The global renewable energy market is set to surge from USD 1.74 trillion in 2025 to USD 8.25 trillion by 2035, growing at a CAGR of 16.84%. While Asia Pacific dominates with 40.71% share, the fastest growth is occurring in solar and commercial segments. This article goes beyond headline numbers to uncover the underlying supply chain realignment—particularly the shift from hydropower to solar and the role of AI in optimizing asset performance. Major investors like BlackRock and Goldman Sachs, along with startups like Form Energy and Lhyfe, are reshaping the competitive landscape. We also examine how AI platforms such as Orennia's Ion_AI are becoming essential for trend analysis and risk management.

E-Mobility

Making E-Mobility a Global Market: What LMICs Reveal About EV Growth, Policy, and Supply Chains
E Mobility

Making E-Mobility a Global Market: What LMICs Reveal About EV Growth, Policy, and Supply Chains

This article frames e-mobility in low- and middle-income countries as a market-building story, not just a technology adoption story. Drawing on a 2023 perspective article and the report "Mapping the e-Mobility Transition: Opportunities and Enablers," it examines how policy frameworks, infrastructure, and workforce development shape EV growth across six markets: Michigan, California, India, China, South Africa, and Brazil. The piece will connect near-term business opportunities in light-duty vehicles and adjacent electrifying segments to deeper questions about industrial policy, local value creation, and how LMICs can influence global EV supply chains over the next five to ten years.

Electric Mobility Market Size, Share, Trends, and Forecast 2025–2034: Asia Pacific Leads, Lithium-Ion Dominates, and EV Demand Accelerates
E Mobility

Electric Mobility Market Size, Share, Trends, and Forecast 2025–2034: Asia Pacific Leads, Lithium-Ion Dominates, and EV Demand Accelerates

The global electric mobility market is entering a high-growth phase, rising from USD 744.20 billion in 2025 to USD 4,719.79 billion by 2034 at a CAGR of 22.96%. This article will explain the economic logic behind the surge: why Asia Pacific leads revenue, why electric cars and lithium-ion batteries dominate, and how segment shifts in commercial use, drive systems, and regional competition will reshape supply chains. It will also verify the latest market figures and situate them alongside broader electric mobility trends, including battery material dependence, platform standardization, and the emerging North America growth story.

Electric Vehicle Market Forecast 2026-2033: BEVs, Asia Pacific Dominance, and the Supply Chain Shifts Driving Growth
E Mobility

Electric Vehicle Market Forecast 2026-2033: BEVs, Asia Pacific Dominance, and the Supply Chain Shifts Driving Growth

The global electric vehicle (EV) market is set to expand from USD 495.30 billion in 2026 to USD 837.93 billion by 2033 at a CAGR of 7.8%. Battery electric vehicles (BEVs) will capture 68.8% of the market, while passenger vehicles dominate with 73.4% share. Asia Pacific leads with 65% market share, yet Latin America emerges as the fastest-growing region at 4.8%. Key events—Foxtron’s debut EV, Maruti Suzuki’s e-VITARA launch, Tata Motors’ five-new-EV plan, and Renault’s Brazil expansion—signal deep shifts in OEM strategies and supply chains. This article dissects the numbers behind the headlines, explores the implications for battery production and charging infrastructure, and reveals the underlying economic logic driving global electric mobility trends.