How Highcharts Dashboards Powers Interactive Climate Data Visualization for a Sustainable Future
Climate data visualization is critical for monitoring environmental changes and informing policy decisions. Highcharts Dashboards offers a powerful, flexible library that enables developers and non-technical users to build interactive, real-time dashboards with minimal effort. This article explores the key features—real-time updates, scalability to millions of data points, and multi-language integration—that make Highcharts an ideal choice for climate data. Through a practical example dashboard tracking global cities’ metrics (temperature, elevation, rainfall), we demonstrate how organizations can democratize climate analysis. We also examine the deeper impact: lowering barriers for NGOs, local governments, and researchers to create customized monitoring systems, ultimately accelerating data-driven climate action.
Highcharts Dashboards Enables Interactive Climate Data Visualization for Sustainability
1. Introduction: The Urgent Need for Accessible Climate Data Tools
Climate change is no longer a distant forecast—it is a present reality measured in rising temperatures, shifting rainfall patterns, and extreme weather events. Researchers, policymakers, and the public rely on climate data to understand these changes and inform decisions. Yet raw climate data, often pulled from satellite feeds, weather stations, and historical records, can be overwhelming in its volume and complexity. The gap between data and actionable insight requires tools that are both powerful and accessible.
Interactive dashboards have emerged as a critical bridge. They transform static tables into dynamic visualizations that allow users to explore trends, compare regions, and monitor real-time conditions. Highcharts Dashboards, a component of the Highcharts family, offers a flexible library designed to handle the unique demands of climate data visualization. With built-in support for real-time updates, large datasets, and cross-platform integration, it enables organizations to build custom monitoring systems without starting from scratch.
This article examines the core features that make Highcharts Dashboards a natural fit for climate monitoring, walks through a practical example, and explores the broader impact on democratizing climate analysis for NGOs, local governments, and research teams.
[IMAGE: Screenshot of a climate dashboard showing a world map with color-coded markers and line charts for temperature trends.]
2. Core Features That Make Highcharts Dashboards a Climate Data Powerhouse
Climate data visualization demands more than static charts. Data streams change by the minute, datasets span millions of observations, and users need to drill down from global patterns to local specifics. Highcharts Dashboards addresses these requirements through several key capabilities.
Real-Time Data Updates
For climate monitoring, timeliness is everything. Air quality indices update hourly, sea levels change with tides, and weather forecasts require continuous refresh. Highcharts Dashboards supports real-time data binding through its data layer, which can pull from WebSocket connections, REST APIs, or local data sources. The dashboard components automatically re-render when new data arrives, allowing users to watch evolving patterns without manual reload.
Scalability to Handle Massive Datasets
Climate data is inherently large. A single global temperature dataset can contain billions of records spanning decades. Highcharts Dashboards is engineered for performance: it uses efficient rendering techniques that handle thousands to millions of data points without noticeable lag. Features like data grouping aggregate points at lower zoom levels, preserving context while maintaining interactivity. This means a dashboard tracking temperature anomalies across 10,000 weather stations remains responsive even when displaying a century of historical data.
Interactive Exploration
Understanding climate trends requires deeper investigation. Highcharts Dashboards provides drilldown, tooltips, zooming, and panning out of the box. A user can click on a region to see its historical rainfall trend, then zoom into a specific decade to examine year-by-year patterns. Tooltips display exact values on hover, and the crosshair feature helps compare multiple metrics across the same time axis. These interactive elements transform passive viewing into active analysis, which is essential for both scientific research and public engagement.
[IMAGE: Animated GIF showing zooming and drilldown on a climate line chart—user clicks a continent, then zooms into a five-year window with tooltip details.]
3. Multi-Platform Integration: Fitting into Any Tech Stack
Climate organizations rarely operate with a single technology stack. A university research group might use R for statistical modeling, a local government’s website runs on .NET, and an NGO’s mobile app is built with React Native. Highcharts Dashboards—part of the broader Highcharts ecosystem—integrates with a wide range of platforms, making it a practical choice for heterogeneous environments.
Supported Frameworks and Languages
The library is natively built with JavaScript, but it provides official wrappers and integration guides for .NET, React, Python, R, PHP, Java, iOS, Android, Svelte, Angular, and Vue. This means a developer comfortable with Python can use the Highcharts for Python wrapper to generate dashboards server-side, while a frontend team using React can add interactive components directly into their app. The same dashboard logic can be reused across web and mobile platforms.
Frontend and Backend Rendering
Highcharts Dashboards supports both client-side and server-side rendering. For dashboards embedded in public-facing websites, client-side rendering offers full interactivity and real-time updates. For PDF reports or static embedding in legacy systems, server-side rendering generates chart images without requiring JavaScript execution. This dual capability ensures that even organizations with outdated infrastructure can incorporate high-quality visualizations.
Practical Implications
Consider a scenario where a climate research institute maintains a web portal for policymakers, a mobile app for field workers, and an internal reporting tool for data scientists. With Highcharts Dashboards, they can share a common configuration and data structure across all three outputs, reducing maintenance overhead and ensuring consistency. The library’s modular architecture also allows teams to customize only the components they need, avoiding the bloat of a full-featured BI tool.
[IMAGE: Diagram showing logos of JavaScript, React, Python, R, .NET, Java, Angular, Vue, Svelte, iOS, and Android arranged around a central Highcharts icon, connected with arrows.]
4. Practical Example: A Global Cities Climate Dashboard
To illustrate how these features come together, consider a dashboard designed to monitor climate metrics for major cities worldwide. This example mirrors the kind of tool an environmental agency might deploy to track urbanization impacts, compare regional climate patterns, or inform adaptation strategies.
Dashboard Layout and Components
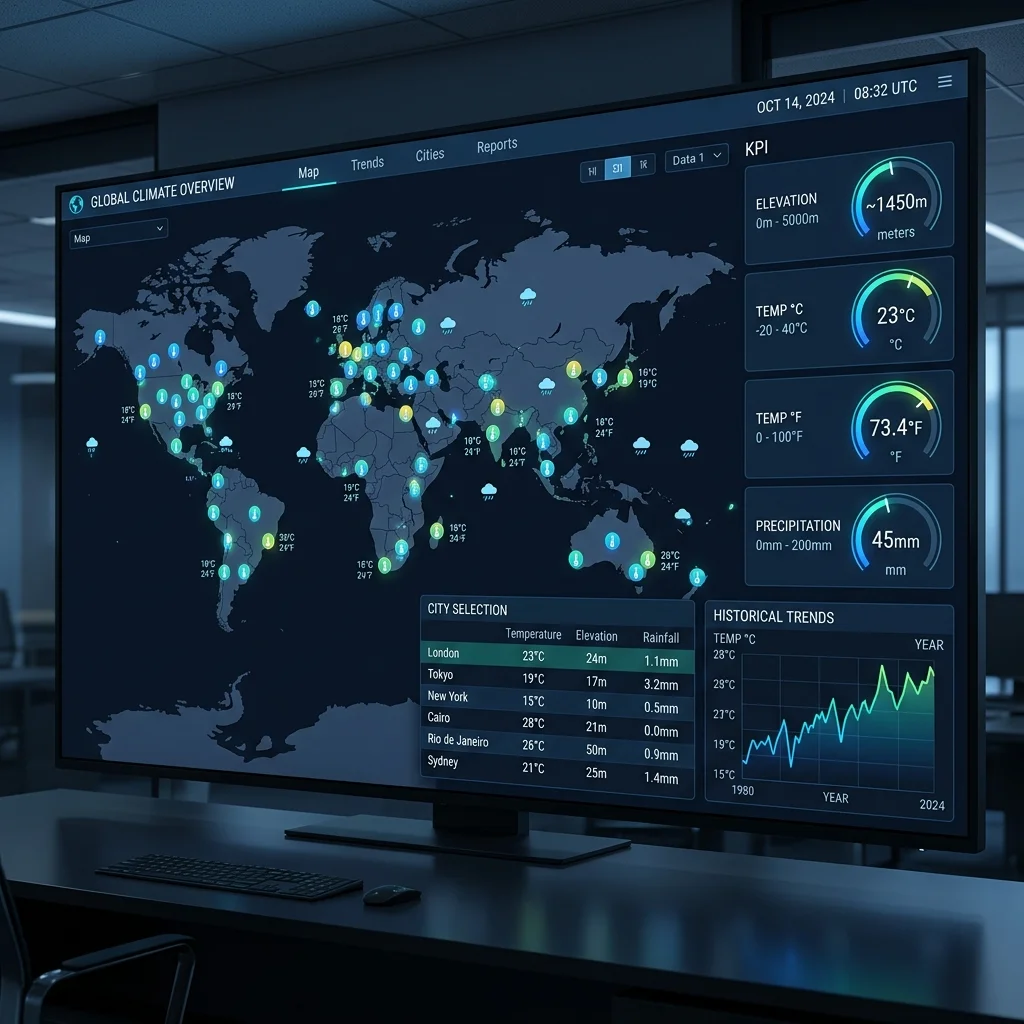
- **World Map Markers:** The primary view displays a world map with markers for each city. Marker size or color encodes a selected metric—average temperature in reds, precipitation in blues. Users can hover over any marker to see the city name and key statistics. This provides an instant geographic overview.
- **KPI Gauges:** Above the map, two gauges show the current city’s elevation and temperature, displayed in both Celsius and Fahrenheit. These gauges update when the user selects a different city from the map or the selection grid. They serve as a “quick glance” summary for critical values.
- **Selection Grid:** Below the map, a sortable table lists all cities with columns for average temperature, maximum temperature, and days with rain. Users can filter by region or search for a specific city. Clicking a row updates all other dashboard components—the map zooms, the KPI gauges change, and the trend chart refreshes.
- **Historical Trend Chart:** At the bottom, a line chart plots the selected city’s average temperature over the past 50 years. The user can toggle between different metrics (temperature, rainfall, humidity) and adjust the date range. Tooltips show exact values, and the chart supports zooming to examine specific decades.
Technical Implementation
The dashboard pulls data from a REST API that aggregates climate records from sources like NOAA and Copernicus. Real-time updates are not needed for historical analysis, but the same architecture can accept live streams for current weather data. The map uses Highcharts Maps, and the gauges are custom Gauge series. The selection grid is powered by Highcharts Dashboards’ built-in data grid component, which supports sorting, filtering, and selection synchronization.
[IMAGE: Mockup of the dashboard: world map on the left, KPI gauges top right, selection grid bottom right, historical trend line chart spanning the bottom third of the page.]
Why This Matters
This dashboard demonstrates how Highcharts Dashboards enables a single-page application that combines geographic, tabular, and time-series views—all connected through shared data binding. An NGO with limited technical resources can deploy a similar dashboard in days, not months, using pre-built components rather than writing custom charting code. The interactive nature allows policymakers to explore “what if” scenarios: for example, selecting coastal cities to compare sea-level rise vulnerabilities.
5. Democratizing Climate Analysis: The Deeper Impact
Beyond technical capabilities, the broader significance of tools like Highcharts Dashboards lies in their potential to lower barriers to climate analysis. Historically, building interactive climate dashboards required a team of data engineers, frontend developers, and GIS specialists. The cost and complexity excluded many organizations that could benefit most—small NGOs tracking local deforestation, municipal governments monitoring air quality, or community groups advocating for climate resilience.
Reducing Development Time and Costs
Highcharts Dashboards provides pre-built components—maps, charts, gauges, grids—that handle common visualization patterns out of the box. Developers no longer need to write custom rendering logic for every metric type. The library also handles data binding, responsive layouts, and cross-component synchronization automatically. This reduces development time from weeks to days, and the open-source licensing (with commercial options) eliminates the recurring costs of proprietary BI platforms.
Enabling Non-Technical Users
The dashboard’s configuration can be driven by JSON definitions, meaning a data analyst with basic JavaScript knowledge can create or modify dashboards without deep frontend expertise. For climate researchers who are experts in their field but not in web development, this is transformative. They can focus on data interpretation rather than coding.
Accelerating Data-Driven Climate Action
When more organizations can build customized monitoring systems, climate data becomes a public good rather than a privilege of well-funded institutions. Local governments can track heat island effects in their cities. NGOs can monitor deforestation rates in near real-time. Grassroots groups can visualize the impact of policy changes on their communities. Each of these dashboards contributes to a broader ecosystem of evidence-based decision-making.
The ultimate result is a more informed public, more responsive policies, and a faster collective response to the climate crisis. Highcharts Dashboards, by making interactive climate data visualization accessible, helps turn raw numbers into a shared language for sustainability.
[IMAGE: A photograph of a small team of researchers or NGO workers gathered around a laptop displaying a climate dashboard, with a world map and trend lines visible.]
---
*Highcharts Dashboards is part of the Highcharts suite of data visualization libraries. For hands-on examples and documentation, visit the official Highcharts Dashboards page.*