interactive dashboards

Articles tagged “interactive dashboards

3 articles found

How Highcharts Dashboards Powers Interactive Climate Data Visualization for a Sustainable Future
Eco Visuals

How Highcharts Dashboards Powers Interactive Climate Data Visualization for a Sustainable Future

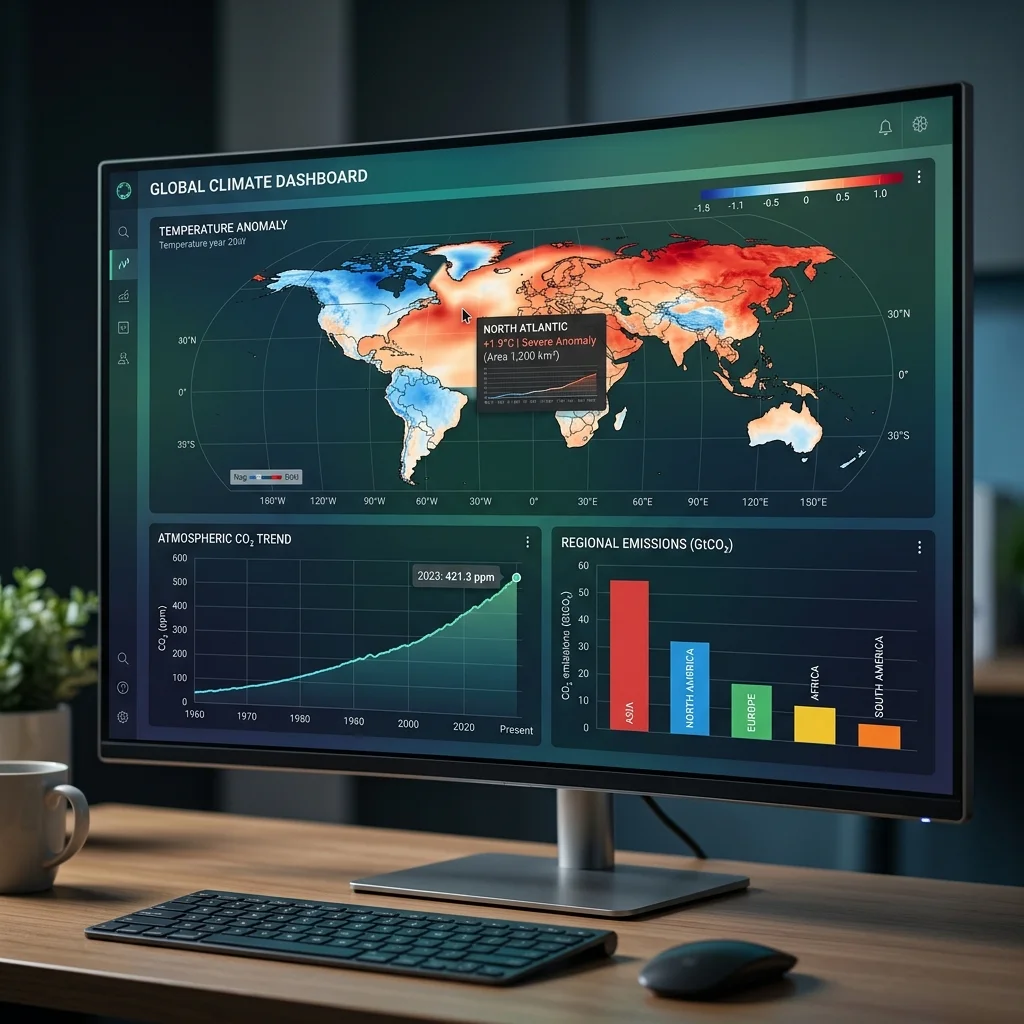
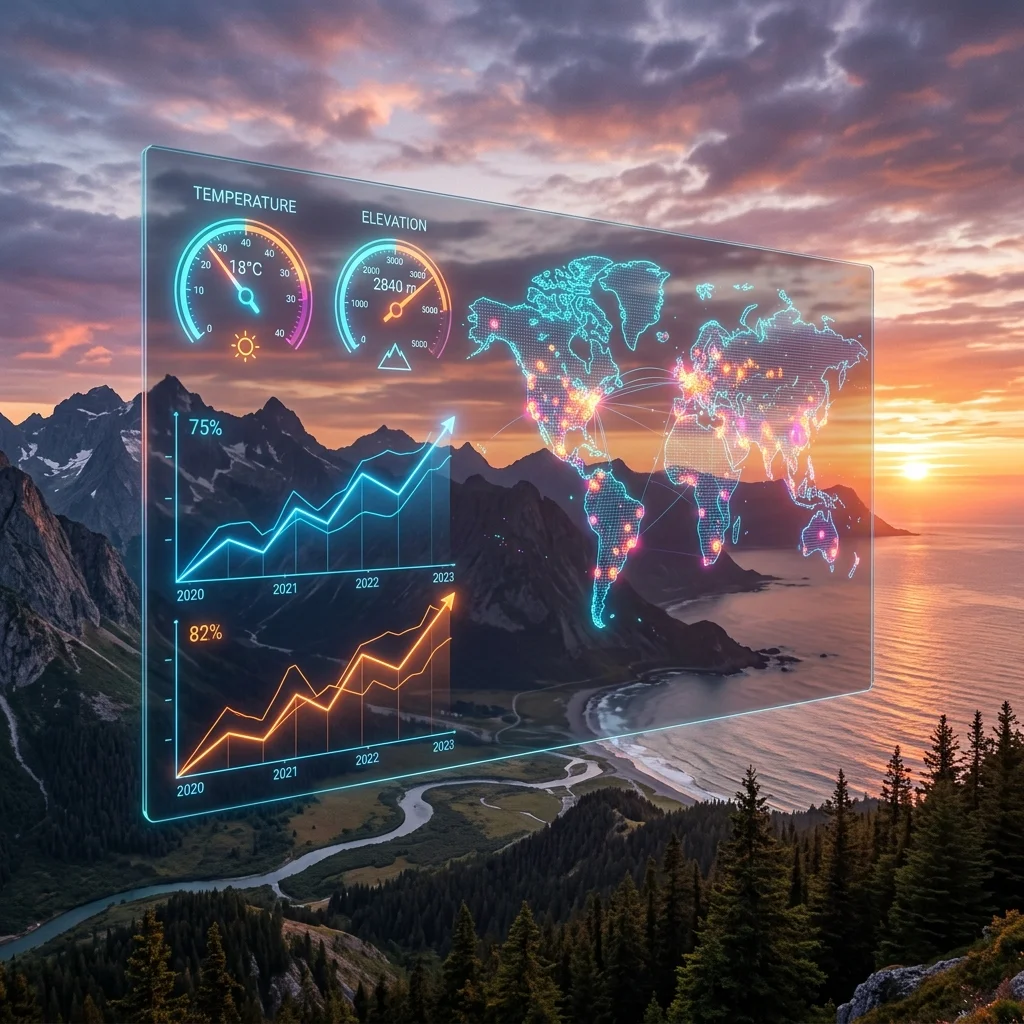
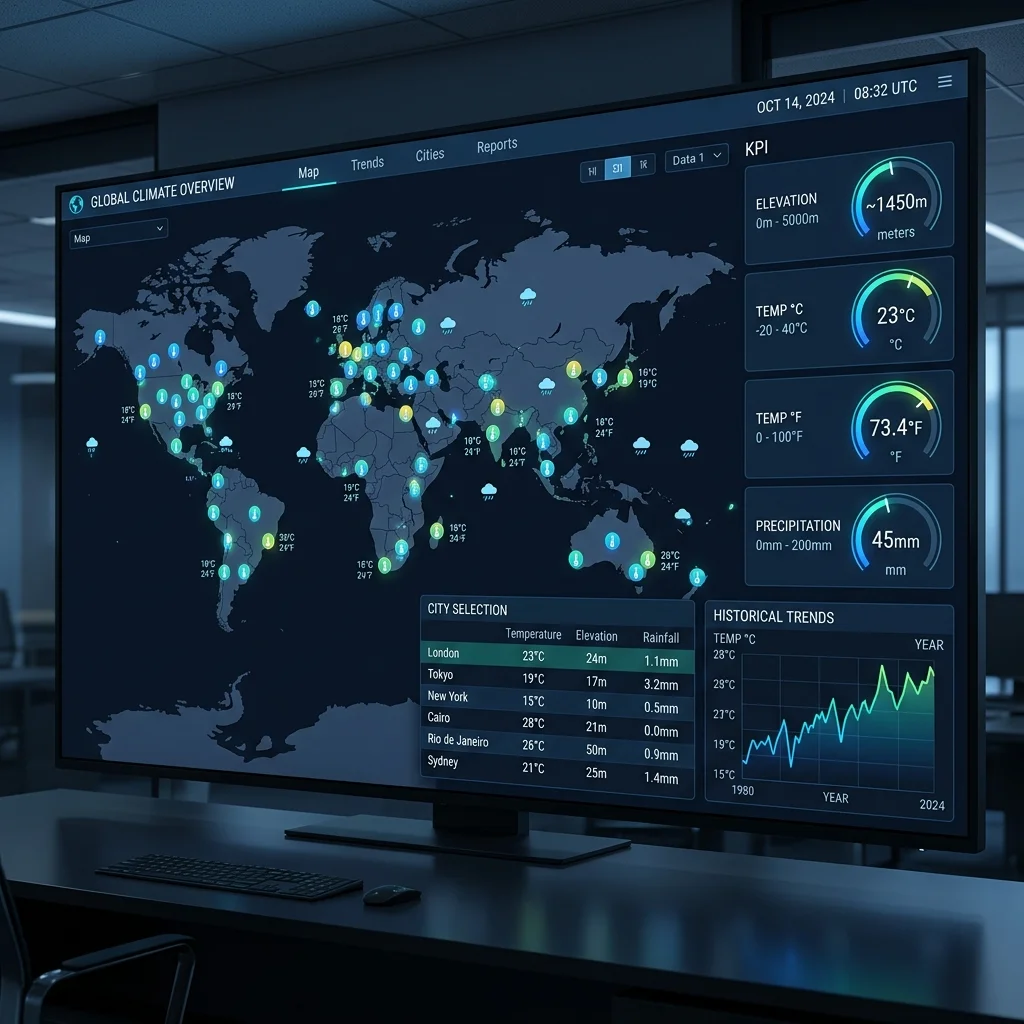
Climate data visualization is critical for monitoring environmental changes and informing policy decisions. Highcharts Dashboards offers a powerful, flexible library that enables developers and non-technical users to build interactive, real-time dashboards with minimal effort. This article explores the key features—real-time updates, scalability to millions of data points, and multi-language integration—that make Highcharts an ideal choice for climate data. Through a practical example dashboard tracking global cities’ metrics (temperature, elevation, rainfall), we demonstrate how organizations can democratize climate analysis. We also examine the deeper impact: lowering barriers for NGOs, local governments, and researchers to create customized monitoring systems, ultimately accelerating data-driven climate action.

Mastering Climate Data Visualization: Techniques, Best Practices, and Tools for Impactful Communication
Eco Visuals

Mastering Climate Data Visualization: Techniques, Best Practices, and Tools for Impactful Communication

Climate data visualization transforms complex datasets into compelling stories that drive awareness and action. This article explores essential techniques—from choosing the right chart type (line charts for trends, maps for geography, bar charts for comparisons) to designing clear, interactive dashboards. Learn how to avoid common pitfalls like overloaded visuals and unclear scales, and discover how adding context (timeframes, benchmarks) and interactivity (tooltips, filters) boosts engagement. Drawing on expert insights from the Infogram Team, we provide a practical guide for anyone communicating climate science effectively.

Beyond the Gauge: Unlocking Climate Intelligence with Highcharts Dashboards
Eco Visuals

Beyond the Gauge: Unlocking Climate Intelligence with Highcharts Dashboards

This article explores how Highcharts Dashboards transforms raw climate data into actionable intelligence. While many focus on the visual appeal of charts, we dig into the hidden economic logic: the shift from static reports to real-time, scalable decision-support systems. We analyze how features like real-time updates, drilldowns, and support for massive datasets are enabling a new era of climate analytics for cities, researchers, and policymakers. The article dissects a practical dashboard example—featuring KPI gauges, selection grids, and historical trends—to reveal how these tools bridge the gap between data complexity and strategic action, ultimately driving investment and policy in climate resilience.