Mastering Climate Data Visualization: Techniques, Best Practices, and Tools for Impactful Communication
Climate data visualization transforms complex datasets into compelling stories that drive awareness and action. This article explores essential techniques—from choosing the right chart type (line charts for trends, maps for geography, bar charts for comparisons) to designing clear, interactive dashboards. Learn how to avoid common pitfalls like overloaded visuals and unclear scales, and discover how adding context (timeframes, benchmarks) and interactivity (tooltips, filters) boosts engagement. Drawing on expert insights from the Infogram Team, we provide a practical guide for anyone communicating climate science effectively.
Mastering Climate Data Visualization: Techniques, Best Practices, and Tools for Impactful Communication
Climate data visualization serves as the primary mechanism for translating vast, multidimensional datasets—temperature anomalies, atmospheric CO₂ concentrations, sea-level rise, and regional precipitation shifts—into formats that non-specialist audiences can interpret. As climate change accelerates, the ability to communicate these trends clearly becomes a functional requirement for scientists, policymakers, and media organizations. According to the Infogram Team’s 2026 article on the subject, effective visualization reduces cognitive load, reveals patterns otherwise hidden in spreadsheets, and supports decision-making (Source: Infogram Team, 2026). This article systematically examines the techniques, design principles, and interactive features that transform raw climate data into actionable insights, drawing on established best practices and the specific capabilities of platforms such as Infogram.
Why Climate Data Visualization Matters
Raw climate datasets typically consist of time-series readings, geographic coordinates, and categorical comparisons. A spreadsheet containing 140 years of global temperature records, for instance, offers little intuitive meaning to a reader untrained in statistical analysis. Visualization restructures this data into spatial and temporal patterns—a line chart rising over decades or a map shading regions by drought severity—that allow the human visual system to detect anomalies, trends, and outliers within seconds. The Infogram Team’s analysis emphasizes that bridging the gap between scientific complexity and public comprehension is the core function of visualization, especially given the urgency of climate change (Infogram Team, 2026). Graphs, maps, and dashboards do not merely decorate data; they impose a logical narrative by highlighting what is significant and what requires action. The split between a data table and a well-designed infographic is not aesthetic—it is epistemological.
Choosing the Right Visualization for Your Data
Selecting the appropriate chart type depends on the nature of the data and the specific question the visualization aims to answer. The Infogram Team identifies four primary categories commonly used in climate communication (Infogram Team, 2026):
- **Line charts**: Optimal for displaying trends over continuous time intervals. A line chart plotting annual global temperature anomalies from 1880 to 2025 immediately shows the acceleration of warming in recent decades. The continuity of the line reinforces the conceptual link between successive data points.
- **Maps**: Essential for geographically distributed variables such as regional drought intensity, flood risk zones, or per‑nation emission levels. Choropleth maps, when paired with intuitive color scales, allow viewers to compare spatial patterns at a glance.
- **Bar charts**: Best suited for comparing discrete categories—for example, per‑capita CO₂ emissions by country or sector. The length of each bar provides a proportional, easily comparable visual metric.
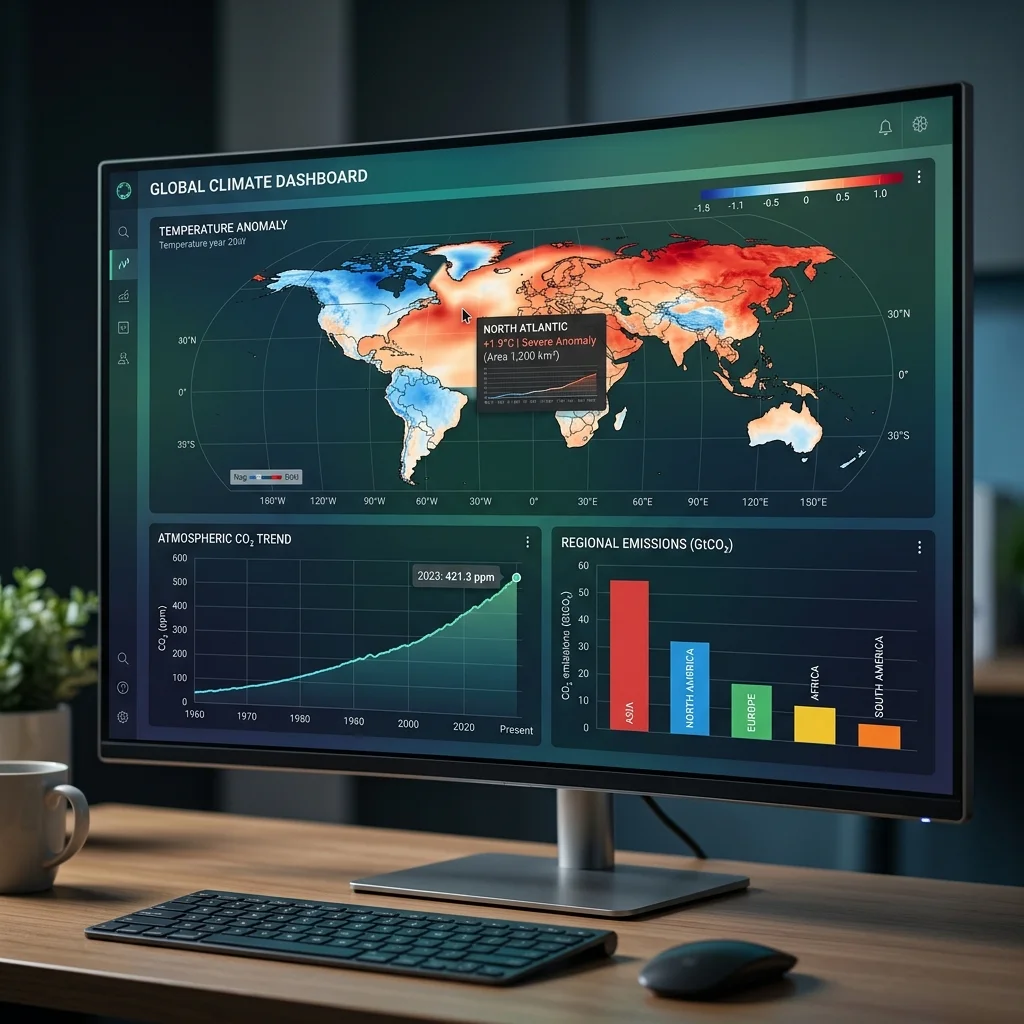
- **Dashboards**: Combine multiple chart types on a single screen to monitor several indicators simultaneously. A climate dashboard might display real-time CO₂ readings, a global temperature trend line, and a map of ice-sheet mass loss, enabling holistic situational awareness.
The choice among these formats must be driven by the data structure, not by aesthetic preference. Using a pie chart to show emission trends over time, for instance, would obscure temporal progression and violate the fundamental requirement of aligning chart type with data dimensionality.
Design Principles for Clarity and Impact
Even a correctly selected chart type can mislead if its visual encoding is poor. The Infogram Team outlines several design principles that reduce misinterpretation (Infogram Team, 2026):
- **Simplicity**: Limit the number of variables or data series shown in a single graphic. Displaying more than three or four overlapping trends in a line chart creates visual clutter and increases the likelihood of misreading. Each additional variable should be justified by a specific analytical need.
- **Consistent color scales**: Color is the most powerful visual variable but also the most prone to misuse. For climate data, intuitive associations should prevail—red for warming, blue for cooling—and rainbow palettes should be avoided because they introduce artificial boundaries and are not perceptually uniform.
- **Functional minimalism**: Decorative elements such as 3D effects, unnecessary gridlines, or background images that do not carry data reduce the signal‑to‑noise ratio. Every pixel should serve the data story; elements that do not are distractions.
- **Context provision**: A visualization without temporal framing, baseline comparisons, or annotations is ambiguous. The Infogram Team stresses that timeframes, historical baselines (e.g., “2°C above pre‑industrial levels”), and benchmark targets (e.g., Paris Agreement commitments) must be embedded directly in the graphic.
A before-and-after comparison illustrates the principle: a cluttered chart with overlapping lines, rainbow colors, and no axis labels fails to communicate; a cleaned version with a consistent blue-red palette, labeled axes, and a shaded reference band for the 1.5°C threshold communicates the key insight in under three seconds.
Adding Context and Annotations
Context transforms a chart from a visual representation of numbers into an evidence-based argument. The Infogram Team identifies several contextual elements that should be included (Infogram Team, 2026):
- **Explicit timeframes**: A line chart should always state the period it covers (e.g., 1880–2025). Without this, the viewer cannot assess whether the trend is short-term fluctuation or long-term change.
- **Historical baselines**: Comparisons to pre‑industrial levels or the 1961–1990 average ground the data in a reference point. The phrase “2°C above pre‑industrial levels” only becomes meaningful when the baseline is visually marked on the chart.
- **Policy benchmarks**: Vertical lines or shaded zones representing the Paris Agreement targets, carbon budget limits, or emission reduction milestones provide evaluative framing.
- **Explanatory callouts**: Brief annotations on significant events—the signing of the Kyoto Protocol, the release of IPCC reports—help the viewer correlate data jumps with real-world occurrences.
These contextual elements should be integrated into the visualization itself, not relegated to a caption or separate text block. When context is physically adjacent to the data, the cognitive effort required to connect them is eliminated.
Leveraging Interactivity and Human Impact
Static visualizations have inherent limits: they cannot accommodate user-driven exploration or scale to data density. Interactive features address these deficits by allowing the viewer to engage personally with the narrative. The Infogram Team lists hover tooltips, filter controls, and zoom capabilities as the most effective interactive elements for climate data (Infogram Team, 2026). Tooltips reveal precise values without cluttering the main display; filters let users isolate specific countries, time periods, or emission sources; zoom enables micro‑level inspection of high-density time series.
Interactivity also enables the layering of qualitative information alongside quantitative data. Photographs of communities affected by sea-level rise, short video clips of glacier retreat, or personal anecdotes from climate-affected regions can be embedded as clickable annotations. This combination does not simply add emotional weight—it provides a concrete referent for abstract numbers. When a viewer sees a CO₂ reading of 420 ppm alongside an image of a flooded neighborhood, the statistic acquires spatial and human scale. The causal chain is logical: visualization presents the data, interactivity lets the user explore its implications, and human context grounds those implications in lived reality.
Common Pitfalls and How to Avoid Them
Even experienced communicators fall into recurring errors. The Infogram Team catalogs four prevalent mistakes (Infogram Team, 2026):
1. **Overloading the visualization**: Including too many variables, categories, or data points in a single chart. Remedy: split into multiple focused graphics or use interactive filters. 2. **Unclear scales**: Omitted axis labels, non-zero baselines on bar charts, or logarithmic scales without explanation. Remedy: always label axes, start bar charts at zero, and explain scale transformations. 3. **Missing labels and legends**: Charts without annotations force the viewer to guess what each color, symbol, or line represents. Remedy: place a clear legend adjacent to the graphic and label key data points. 4. **Wrong chart type**: Using pie charts for time series, area charts for multiple comparisons, or 3D effects for precision. Remedy: match the chart type to the data structure per the guidelines above.
Systematic pre-publication review against this checklist can eliminate most sources of misinterpretation.
Platforms and Tools: The Role of Infogram
The technical implementation of these principles depends on the visualization platform used. Infogram, as referenced by the Infogram Team, provides a cloud-based environment that combines charting, mapping, and real-time data integration. Its library of templates and interactive widgets allows users to deploy the best practices described above without writing code. The platform’s capability to embed live data feeds—for instance, streaming CO₂ readings from Mauna Loa or satellite-derived temperature anomalies—enables dashboards that update automatically, keeping the visualization relevant as new data arrives (Infogram Team, 2026). For organizations that must produce frequent climate reports, such automation reduces manual effort and ensures consistency.
Future Outlook: Predictions for Climate Data Communication
As climate data volumes grow—from higher-resolution satellite imagery, denser sensor networks, and more frequent climate models—the demand for sophisticated visualization will intensify. Three trends are predictable:
- **Increased adoption of interactive dashboards** over static infographics, driven by user expectations for self-directed exploration and real-time updates.
- **Platform specialization**: Tools like Infogram will likely develop domain-specific features—for example, pre‑built climate indicator templates, direct API connections to global climate databases (Copernicus, NASA GISS), and AI-assisted chart selection based on data type.
- **Rising standards for data literacy**: As more stakeholders (investors, local governments, supply-chain managers) rely on visualized climate data for decisions, the cost of misinterpretation will rise. This will pressure visualization producers to adhere to formal best-practice guidelines, possibly leading to industry certification or audit-like review processes.
The ultimate measure of a climate visualization is not its aesthetic appeal but whether it enables the viewer to reach an accurate conclusion faster than they could from raw data alone. Adherence to the techniques and principles outlined here—right chart type, simplicity, context, interactivity, error avoidance—determines that measure. The Infogram Team’s 2026 analysis provides a structured foundation for practitioners, but the ongoing challenge is to apply these rules rigorously while the data itself continues to evolve.