Beyond the Chart: Crafting Climate Data Visualizations That Drive Understanding
In climate reporting, a well-designed visualization can turn complex data into a clear narrative, but a poor one can confuse or mislead. This article translates the principles behind effective climate data graphics—from labeling and sourcing to historical context—into a practical framework for journalists and data storytellers. Drawing on real-world examples and expert quotes, it explains why every visual must enrich, not decorate, the story. The guide also reveals a hidden economic logic: clarity in visualization lowers the cognitive cost for audiences, increasing trust and retention. By avoiding jargon and overloading, reporters can help readers grasp long-term trends and make informed decisions about climate action.
Beyond the Chart: Crafting Climate Data Visualizations That Drive Understanding
**Published:** February 28, 2023 **Source:** ReportingWithNumbers.com Climate Reporting Guide
Introduction: The High Stakes of Visual Clarity in Climate Reporting
Climate data presents a fundamental comprehension barrier: the underlying phenomena—atmospheric carbon concentrations, temperature anomalies, precipitation shifts—are inherently abstract and technically complex. Most audiences lack the specialized training to interpret raw numerical tables or decipher scientific nomenclature. This gap between data complexity and public understanding creates both an informational crisis and an opportunity for journalists who can bridge it.
The core principle governing effective climate visualization is unambiguous: each graphic must earn its place by deepening the reader’s understanding, not by filling space. As the reporting guide states, “Don’t add a graphic simply for the sake of having non-textual content” (Source 1: Reporting Guidelines). This is not an aesthetic preference but a functional necessity. Every visual element imposes a cognitive cost on the reader, who must allocate mental resources to decode its meaning. When that decoding yields no corresponding insight, the graphic becomes noise—reducing the overall informational return on the reader’s investment of time and attention.
This framework reveals an underlying economic logic. Well-designed visuals reduce cognitive load, increasing the probability that readers will trust, retain, and act upon the information presented. Poor visuals create friction, diminishing what might be termed the “informational ROI” of the reporting. The stakes are particularly high in climate coverage, where comprehension directly influences policy preferences, consumer behavior, and civic engagement.
The following analysis employs a dual-track approach: fast analysis provides an immediate checklist for editors evaluating graphics before publication; slow analysis offers a deep audit of how visualization choices impact long-term audience comprehension and trust.
1. The Anatomy of a Trustworthy Climate Graphic
Trust in climate data visualization begins with structural clarity. Four mandatory elements establish a graphic’s credibility: a clear title, properly labeled axes, comprehensive source citations, and legible legends or keys (Source 1: Reporting Guidelines).
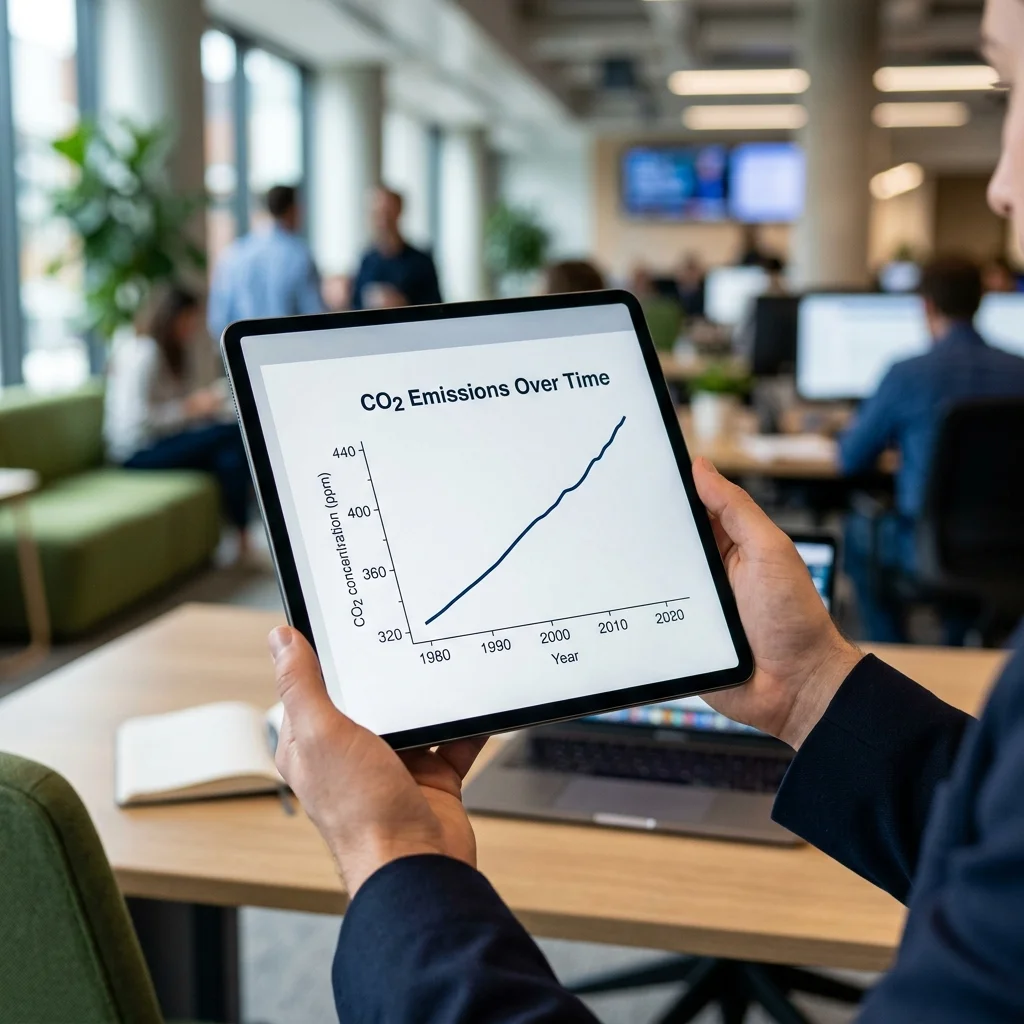
The carbon dioxide emissions graph presented as a “DO THIS” example demonstrates this architecture effectively. It contains a descriptive title positioned prominently, both X and Y axes labeled with units of measurement, and a source citation that allows readers to verify the data independently. These elements function as “trust signals”—visual cues that the information has been vetted and can be relied upon.
The “DON’T DO THIS” temperature anomalies graph reveals what happens when these signals are absent. The graphic lacks a title entirely, offers no clear axis labels identifying what is being measured over what timeframe, and provides no sourcing information. A reader encountering this visualization cannot determine what the data represents, where it originated, or how to interpret the trends displayed. As the guidelines note, “Labels and keys help a reader make sense of what they’re seeing in a graph” (Source 1: Guidelines).
The economic logic is straightforward. When labels are unclear, readers must guess at meaning. Each guess carries a risk of misinterpretation, and repeated ambiguity erodes trust in the entire publication. The mental effort required to process an unlabeled graphic exceeds the informational value it provides, creating a net negative for the reader’s cognitive budget.
**Recommended Trust Signal Checklist:** - Title positioned at top, clearly visible - X-axis labeled with variable and unit - Y-axis labeled with variable and unit - Source citation with publication date - Legend or key when multiple variables are plotted - Footnote explaining any methodological notes
2. Writing Titles That Tell the Story—Not the Science
A persistent pattern emerges in climate reporting: journalists adopt technical titles directly from scientific studies, presuming that precision equals clarity. This assumption is incorrect. Scientific titles serve the needs of peer reviewers and specialized readers; public-facing titles must serve a different audience with different baseline knowledge.
The Wisconsin warming winters map provides an instructive case. The original graphic carried the title: “Change in DJF TMEAN, RCP45, 2041-2060 minus 1981-2010.” This string of characters requires decoding: “DJF” refers to December-January-February, “TMEAN” denotes mean temperature, “RCP45” identifies a specific emissions scenario, and the hyphenated numbers indicate time periods. A climate scientist would parse this instantly; a general reader would likely abandon the attempt.
The prescribed fix is to rewrite the title in plain English: “Wisconsin winters could warm by 5°F by mid-century.” This version states the finding directly, using familiar units and a specific geographic reference. The underlying data remains identical; only the framing changes. As the guidelines emphasize, “You will almost always need to write a title different from the one that appeared in the original source–particularly when the source is a scientific study” (Source 1: Guidelines).
This is not merely a translation exercise. It represents a fundamental shift from data presentation to narrative framing. The title establishes the reader’s interpretive frame before they examine the visual itself. A title that asks “What does ‘DJF TMEAN’ mean?” creates confusion. A title that states “Winters will warm” creates an expectation the graphic can then confirm with evidence. The journalist exercises significant power in choosing that frame, and that power carries responsibility for accuracy.
**Title Translation Protocol:** 1. Identify the core finding (temperature increase, pattern shift, threshold crossed) 2. Express it in conversational language using familiar units (degrees Fahrenheit, inches of rain, percentage change) 3. Include geographic specificity (state, region, city) when applicable 4. Remove all acronyms and technical abbreviations 5. Test the title on a non-specialist reader before publication
3. Legends, Captions, and the Architecture of Comprehension
Legends and captions serve as the bridge between the visual language of the graphic and the reader’s conceptual framework. When these elements fail, the graphic becomes a cipher—visually appealing but functionally useless.
The polluted waterways graphic identified as a “DON’T DO THIS” example demonstrates failure at this bridge function. Its captions and axis labels are unclear, leaving readers to interpret the data through guesswork. A reader cannot determine whether the visualization shows pollutant concentrations over time, geographic distribution of contamination, or comparative risks across water bodies. Each uncertainty compounds, increasing cognitive load until many readers simply abandon the graphic entirely.
Proper legend placement follows a logic of visual hierarchy. The legend should appear in proximity to the data it explains, typically in the upper-right quadrant or just below the graphic. Color keys must use distinct, colorblind-accessible hues with clear labels. When multiple scenarios or datasets are plotted, each line or region must be explicitly identified, not relegated to a footnote.
The drought map for Missouri demonstrates effective implementation. Its legend clearly defines the color ramp from “abnormally dry” to “exceptional drought,” providing both a visual reference and verbal definitions. A reader can immediately determine which areas face the most severe conditions without cross-referencing external information.
**Caption Structure Template:** - First sentence: State the main finding the graphic reveals - Second sentence: Identify the time period and geographic scope - Third sentence: Note any methodological caveats (seasonal adjustments, data gaps) - Source line: Publication name, date, and access URL
4. Avoiding Data Overload: The Case for Visual Simplicity
The temptation to maximize information density is strong in data journalism. More data points, more scenarios, more variables—the logic seems to be that more information equals more insight. This logic is false. The human visual system has finite processing capacity, and exceeding that capacity produces not comprehension but confusion.
The renewable energy trends graphic from StartUsInsights illustrates this failure. It attempts to display multiple renewable energy sources, multiple time periods, and multiple projections in a single visualization, resulting in a cluttered, unreadable product. The graphic lacks helpful information precisely because it contains too much information (Source 1: Example Analysis). The reader cannot identify any single trend among the overlapping lines and bars.
By contrast, the “DO THIS” examples consistently limit variables to a manageable number. The water scarcity story breaks down individual water use categories in a simple bar chart. The carbon dioxide emissions graph shows a single time series with clear trend lines. Each graphic answers one question clearly rather than attempting to answer three questions poorly.
The principle of cognitive load management dictates that journalists should ask: “What is the single most important insight this graphic should convey?” If multiple insights are necessary, multiple graphics may be required. Compression of information into a single visual should be resisted unless the relationships between variables are themselves the story being told.
**Simplicity Checklist:** - Maximum of three variables plotted in a single graphic - Maximum of five lines on a line chart - Color palettes limited to six distinct colors - No overlapping text or data labels - Whitespace preserved between visual elements - Gridlines minimized or removed entirely
5. Historical Context as the Foundation for Trend Comprehension
Climate change is definitionally a temporal phenomenon. Its significance emerges not from single-year measurements but from multi-decade trends. Presenting data without historical context is like showing a photograph without explaining that the landscape has changed fundamentally over the preceding century.
The single-year ozone levels graph for Connecticut (identified as a “DON’T DO THIS” example) commits this error. It shows ozone measurements for 2022 alone, providing readers no baseline for comparison. Is 2022 high, low, or average relative to historical norms? The graphic cannot answer this question, and readers are left to guess.
The correction is demonstrated by the Louisiana air quality graph, which presents ozone data “since mid-1990s” (Source 1: Example Analysis). This temporal scope allows readers to see the long-term decline in ozone exceedance days, contextualizing current measurements within a trend. A single year that appears higher than the previous year might alarm readers unnecessarily if they cannot see the decade-long downward trajectory.
The guidelines capture this logic precisely: “By bringing historical data into the charts and graphics you incorporated into your reporting, you’re giving audiences a baseline for comparing where we are to where we were” (Source 1: Guidelines). This baseline transforms isolated data points into narrative evidence. It answers the implicit question readers bring to every climate graphic: “Is this normal? Is this getting better or worse?”
**Historical Context Minimum:** - At least 10 years of data for trend identification - Baseline period clearly marked (e.g., “1981-2010 average”) - Current year highlighted or annotated - Trend line or moving average plotted alongside raw data - Statistical significance of trends noted when available
6. The Informational ROI Model: Quantifying Visualization Value
The economic logic referenced throughout this analysis can be formalized into an Informational Return on Investment (I-ROI) model for climate graphics:
**I-ROI = (Information Transferred) / (Cognitive Effort Expended)**
Information transferred is measured by the number of accurate insights the reader can extract independently. Cognitive effort is measured by the time and mental resources required to decode the graphic. A graphic with high I-ROI transfers significant information with minimal effort. A graphic with low I-ROI demands high effort for minimal understanding.
Practical implications follow from this model:
**High I-ROI graphics** (the “DO THIS” examples) share structural features: clear titles, labeled axes, historical context, limited variables. They minimize uncertainty at every step of the decoding process. The reader knows what they are looking at, what it means, and how it connects to other information they have consumed.
**Low I-ROI graphics** (the “DON’T DO THIS” examples) share failure modes: unclear titles, absent labels, single-year data, excessive variables. They maximize guesswork, creating a feedback loop of confusion that discourages further engagement.
Journalists should evaluate every graphic against this model before publication. If the I-ROI calculation suggests negative returns—more effort required than insight gained—the graphic should be redesigned or removed.
7. Future Trends in Climate Data Visualization
Several developments will shape how climate data is visualized for public audiences in the coming years:
**Interactive visualization adoption.** Static graphics will increasingly give way to interactive tools that allow readers to explore data at their own pace, selecting variables and timeframes of personal interest. This shift demands new design principles focused on intuitive navigation rather than static composition.
**Personalized geographic framing.** Readers engage more deeply with climate data when it connects to their specific location. Visualization tools that automatically localize data—showing sea level rise projections for an individual’s coastal zip code or temperature changes for their agricultural region—will see increased adoption.
**Uncertainty visualization standardization.** Climate projections inherently contain uncertainty, yet most graphics present single-point estimates. Journalists will need to develop conventions for displaying confidence intervals, model ranges, and probabilistic outcomes without confusing readers. The World Meteorological Organization’s multi-scenario solar geoengineering graphic (identified as a failure in the guidelines) demonstrates how difficult this remains.
**AI-assisted caption generation.** Automated tools for generating plain-language titles and captions from technical data will improve, reducing the editorial burden of translation. However, the need for human judgment in framing and contextualization will persist, as automated systems cannot evaluate narrative coherence or anticipate audience confusion.
Conclusion: The Journalist’s Visual Responsibility
Climate data visualization is not decoration. It is translation—converting technical information into public understanding. Each graphic carries the potential to either clarify or obscure, to build trust or erode it.
The guidelines examined here establish a clear standard: every visual must enrich, not merely accompany, the narrative. Clarity in labeling, intentionality in title writing, discipline in variable selection, and commitment to historical context are not optional refinements. They are structural requirements for effective communication in a domain where the stakes include public safety, economic policy, and planetary health.
Journalists who internalize these principles will produce graphics that readers trust, remember, and act upon. Those who treat visualization as secondary to text will produce graphics that readers ignore—or worse, misinterpret. The choice between these outcomes is determined not by access to data but by the rigor applied to its presentation.
The future of climate reporting depends not on generating more data, but on making existing data visible, comprehensible, and actionable. That is the journalist’s visual responsibility.