Teal Tool: Democratizing Climate Data Visualization for a Sustainable Future
Teal is a free, interactive climate data visualization tool developed by the World Energy and Meteorology Council (WEMC) that pulls authoritative data from the European Union's Copernicus Services. Covering carbon emissions, temperature, precipitation, wind speed, and solar radiation from 1950 to near real time, Teal offers an intuitive globe map, country-specific hover data, and time-series graphs. Designed especially for youth, its simple interface removes barriers to climate intelligence, empowering students, educators, small businesses, and policymakers to make data-driven decisions. This article explores Teal's features, credibility through its Copernicus partnership, and its deeper economic impact—democratizing access to climate data and potentially disrupting traditional consulting markets. We also examine how Teal can inform supply chain risk assessments and foster a climate-literate generation.
Teal Tool: Democratizing Climate Data Visualization for a Sustainable Future
Introduction: What Is Teal and Why It Matters
In an era where climate data is more abundant than ever, the gap between raw information and actionable insight remains vast. Most climate datasets require specialized training, expensive software subscriptions, or advanced coding skills to interpret. This barrier has long excluded students, small businesses, educators, and grassroots organizations from participating in data-driven climate decision-making.
Teal, a free interactive climate data visualization tool developed by the World Energy and Meteorology Council (WEMC), aims to close that gap. Hosted under the UN CC:Learn affiliation programme, Teal pulls authoritative data from the European Union’s Copernicus Services — specifically the Copernicus Climate Change Service (C3S) and the SECLI-FIRM climate adaptation project. The result is a platform that transforms complex climate datasets into an intuitive, visually compelling experience accessible to anyone with an internet connection.
The tool’s design philosophy is straightforward: remove technical friction. Rather than navigating file formats or statistical software, users encounter a 3D globe that responds to a hover or click. This simplicity is intentional. WEMC has positioned Teal as a resource for the general public — especially youth — who may have climate awareness but lack the tools to explore the underlying data themselves. In a world increasingly shaped by climate risks, democratizing access to reliable climate intelligence is not just an educational goal; it is an economic and social necessity.
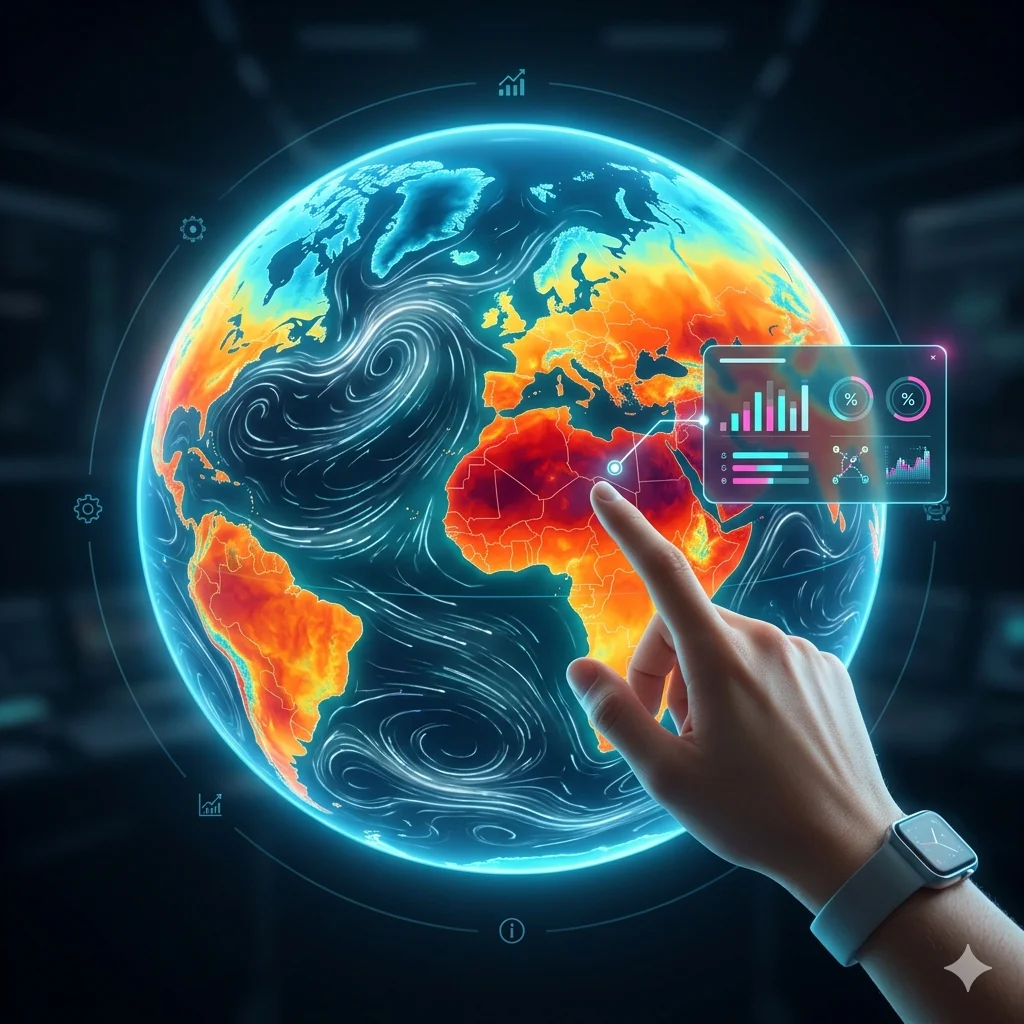
[IMAGE: A screenshot of Teal's landing page showing the globe interface with color-coded variables for carbon emissions and temperature anomalies across continents.]
Key Features and User Experience
Teal’s interface revolves around an interactive 3D globe that offers an immediate sense of spatial context. Users can rotate, zoom, and pan across the planet. When hovering over any country, a pop-up data card displays the current value for the selected variable — air temperature, carbon emissions, precipitation, wind speed, or solar radiation. Clicking on a country generates a time-evolution graph that traces changes from 1950 to near real time, allowing users to see long-term trends and recent anomalies side by side.
The variable selection is handled through a row of colored icons at the top of the screen. Each icon corresponds to a different climate parameter. This design choice eliminates the need for drop-down menus or text-heavy labels, making the tool intuitive for users of all ages. Two additional icons on the left-hand side provide refined filters, such as specifying a year range or narrowing the focus to a particular region. The combination of global overview and granular temporal control gives Teal a unique versatility.
Data coverage spans more than seven decades — from 1950 to the present month — updated regularly with near-real-time inputs from Copernicus. This historical depth enables users to contextualize current events. For example, a teacher can show students how average temperatures in their country have shifted since the mid-20th century, or a small business owner can examine precipitation trends to assess water availability risks.
[IMAGE: Animated GIF or mockup of a user clicking a country on the globe and seeing a line graph of temperature anomalies over decades.]
Data Credibility and Partnerships
The credibility of any climate data visualization tool hinges on the quality of its underlying data. Teal’s institutional backing is a significant strength. All data originates from Copernicus, the European Union’s Earth observation programme, which operates under strict quality assurance protocols. The Copernicus Climate Change Service provides validated, peer-reviewed datasets derived from satellite observations, in-situ measurements, and reanalysis models. SECLI-FIRM, a climate adaptation project that ran from 2017 to 2020, contributed additional research and validation specific to decision-making under climate uncertainty.
Teal’s development was led by WEMC, a non-profit organization that works at the intersection of energy and meteorology. The partnership with UN CC:Learn — a United Nations initiative that promotes climate change learning — ensures that the tool aligns with global educational priorities. This combination of scientific rigor and institutional trust gives Teal an edge over proprietary or less transparent climate data sources. Users can be confident that the numbers they see are not modeled by a black-box algorithm but traceable to a well-established European monitoring infrastructure.
[IMAGE: Logos of Copernicus, WEMC, and UN CC:Learn arranged neatly, with a small caption explaining the data pipeline from satellite observations to Teal’s globe interface.]
Target Audience: Democratizing Climate Intelligence
Teal’s most radical feature is its price: free. The tool removes the financial barrier that has historically restricted access to high-quality climate data. While corporations and well-funded research institutions can afford subscription services from weather data providers or consulting firms, schools, non-profits, and small enterprises often cannot. By offering the same Copernicus-sourced data through a user-friendly interface at zero cost, Teal levels the playing field.
Youth engagement is a core goal. WEMC has designed the interface to be intuitive enough for middle school students to explore independently. The interactive globe invites curiosity — a student can spin the Earth, pick a country they recognize, and immediately see its carbon emissions trajectory or rainfall pattern. This hands-on approach fosters climate literacy in a way that textbooks or passive lectures cannot. Educators can integrate Teal into geography, environmental science, and social studies curricula, turning abstract concepts into tangible visual stories.
Beyond education, the tool serves small businesses and local policymakers who need quick, visual access to climate data for planning. A farmer in sub-Saharan Africa can check precipitation trends before deciding on crop varieties. A municipal planner in Southeast Asia can examine solar radiation data to evaluate the feasibility of rooftop solar panels. These use cases were previously served only by expensive consultants or complex GIS tools. Teal democratizes the ability to ask and answer climate-related questions.
[IMAGE: A diverse group of young students gathered around a tablet displaying Teal’s globe, with one student pointing at a data pop-up.]
Economic Impact: Disrupting the Traditional Consulting Market
The democratization of climate data has profound economic implications. Traditionally, climate risk assessments were the domain of specialized consulting firms that charged significant fees for reports based on proprietary models. Small and medium-sized enterprises (SMEs), non-governmental organizations, and developing-country governments often could not afford these services, leaving them reliant on fragmented or outdated information.
Teal does not replace the deep analytical work of climate consultants, but it does lower the entry barrier for basic climate intelligence. A business owner can now independently check the historical temperature trends for their region, overlay wind speed data to assess renewable energy potential, and examine precipitation records to understand supply chain vulnerabilities. This self-serve capability reduces dependence on third-party reports for initial scoping. Over time, widespread access to free, credible data could compress margins in the lower end of the climate consulting market, forcing firms to offer more value-added services rather than simply repackaging publicly available data.
Moreover, Teal's open-access model aligns with broader trends in data democratization, similar to how platforms like Google Earth and NASA’s Worldview made satellite imagery freely available. As more stakeholders gain baseline climate literacy, the demand for transparent, scientifically sound data will only grow. This could accelerate the adoption of climate risk management practices across sectors that previously ignored them due to cost or complexity.
[IMAGE: A split-screen comparison: on the left, a screenshot of an expensive consulting report cover; on the right, Teal’s interface showing the same region with temperature data — highlighting the cost difference with a visual cue.]
Practical Application: Supply Chain Risk Assessment
One area where Teal can make an immediate impact is supply chain risk assessment. Global supply chains are increasingly vulnerable to climate-related disruptions — floods, droughts, heatwaves, and storms can shut down factories, destroy crops, and delay shipments. Companies typically rely on paid climate intelligence platforms to map these risks. Teal offers a free alternative for preliminary screening.
A sourcing manager, for instance, can use Teal to check precipitation trends across key agricultural regions over the last three decades. If a region shows a clear decline in rainfall, that might signal long-term water stress. Similarly, examining wind speed data can help logistics planners understand the likelihood of shipping delays due to extreme weather events. Solar radiation data can inform decisions about where to locate energy-intensive manufacturing facilities.
While Teal does not generate probabilistic risk models or deliver automated alerts, it provides the raw data needed for internal analysis. For small importers or cooperatives in developing countries — who often lack the budget for commercial risk platforms — Teal can be a critical first step in building climate-resilient supply chains. The tool’s ability to show historical trends from 1950 onward gives users a baseline for understanding whether recent events are outliers or part of a systemic shift.
[IMAGE: A screenshot of Teal showing precipitation data for Southeast Asia, with a user’s cursor hovering over Thailand and a pop-up showing 50-year rainfall trends.]
Fostering a Climate-Literate Generation
Perhaps the most enduring impact of Teal will be in education. Climate literacy — understanding the causes, impacts, and potential responses to climate change — is increasingly recognized as an essential skill for the 21st century. Yet many educational systems lack the tools to move beyond abstract textbook descriptions. Teal allows students to explore real data themselves, fostering critical thinking and data analysis skills.
Teachers can design exercises around the tool: ask students to compare carbon emissions of different countries, investigate correlations between temperature rise and economic development, or track how solar radiation varies with latitude. Because the interface is visual and interactive, it engages multiple learning styles. The time-series graphs encourage students to think about change over time, a concept central to climate science. By confronting real data — rather than pre-digested charts — students develop a more nuanced understanding of uncertainty and variability.
WEMC has also made Teal available under the UN CC:Learn affiliation, which means it can be incorporated into climate education programs worldwide. This institutional support helps ensure that the tool reaches schools and informal learning centers in underserved regions. Over the next decade, a generation of students who grew up spinning Teal’s globe will enter the workforce with a baseline climate literacy that their predecessors lacked.
[IMAGE: A classroom scene where a teacher projects Teal on a whiteboard while students follow along on their own devices, with a line graph of global temperature anomalies visible.]
Conclusion: A Tool for the Sustainable Future
Teal is not the first climate data visualization tool, nor will it be the last. But its combination of free access, authoritative Copernicus data, intuitive interface, and focus on youth and small stakeholders positions it as a significant step toward democratizing climate intelligence. In a field often characterized by jargon, paywalls, and technical barriers, Teal offers a refreshing alternative: a globe that anyone can spin, data that anyone can read, and insights that anyone can use.
The tool’s true value lies not in any single feature but in its cumulative effect. As more individuals gain the ability to explore climate data firsthand, the quality of public discourse around climate policy should improve. As more small businesses integrate basic climate risk assessments into their operations, economic resilience will increase. And as more students develop climate literacy through hands-on exploration, the next generation will be better equipped to navigate a warming world.
Teal is available now at the WEMC website, free of charge. For educators, business owners, policymakers, and curious citizens, it offers an unprecedented window into the planet’s changing climate — and a reminder that data, when made accessible, has the power to drive change.