From Snapshots to Projections: The Evolution of Climate Data Visualization Tools and Their Impact on Decision-Making
This article explores the landscape of climate data visualization tools, from NOAA's simple Data Snapshots to the advanced Weather and Climate Toolkit. It uncovers the hidden economic logic behind the tiered difficulty of these tools, revealing a strategic segmentation that serves different user groups—from the general public to researchers and policy-makers. By examining the technology trends (such as the shift to browser-based platforms and the integration of projection data) and the market pattern of government-led tool development, the article argues that these tools represent a critical infrastructure for climate adaptation. It also highlights the long-term impact on supply chains, particularly for agriculture, insurance, and coastal real estate, and embeds verification sources from Climate.gov and NOAA.
From Snapshots to Projections: The Evolution of Climate Data Visualization Tools and Their Impact on Decision-Making
**Published: November 2024**
Introduction: The Unseen Infrastructure of Climate Understanding
Climate data is only as valuable as the tools that translate it into actionable insights. The ecosystem of free, government-provided visualization tools maintained by NOAA and Climate.gov represents a critical but often overlooked layer of public infrastructure. As of August 10, 2021, the authoritative page cataloging these tools lists five distinct platforms, each occupying a specific position on a spectrum from immediate accessibility to technical sophistication (Source 1: Climate.gov, updated 2021).
The timeline of this catalog is itself instructive. Published November 21, 2014, and updated seven years later, the document captures a period of rapid transformation in climate informatics. In 2014, static maps and downloadable images dominated. By 2021, browser-based platforms with real-time projection capabilities had become standard. This evolution mirrors a broader shift: climate data visualization has moved from retrospective documentation to forward-looking decision support.
The argument advanced here is that the range of difficulties—from simple snapshots to advanced 3D exports—is not accidental. It reflects a deliberate architecture designed to serve different economic and societal needs. These tools are a form of public infrastructure that directly impacts risk assessment in agriculture, insurance, and coastal planning, and their tiered structure reveals the hidden economic logic of climate adaptation.
The Tiered Architecture of Access: Why Ease of Use Matters for Economic Resilience
The Hidden Economic Logic
The segmentation of tools by skill level mirrors the market's need for different depths of analysis. Data Snapshots serve the general public and media for quick communication; NOAA View serves educators and journalists; Climate Explorer serves local planners; Panopoly and Weather and Climate Toolkit (WCT) serve researchers and engineers. This reduces the cost of climate adaptation for smaller entities while still enabling high-end technical work.
A county planner in coastal Florida, for instance, requires different information and different technical capabilities than a reinsurance analyst modeling hurricane risk for a portfolio of commercial properties. Both need climate data. Both face different budget constraints and technical capacities. The tiered architecture of tools addresses this divergence without requiring either party to build proprietary solutions from scratch.
Data Snapshots: The Fast Food of Climate Data
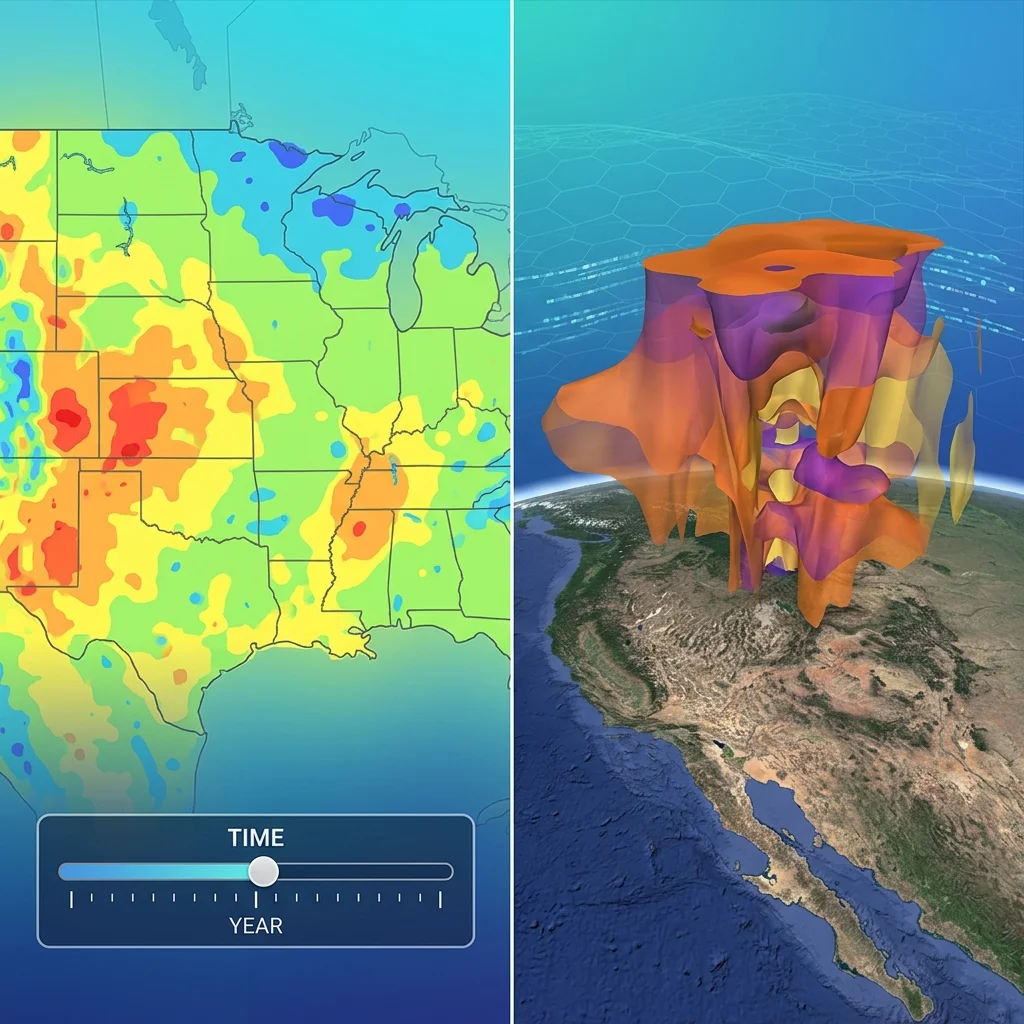
Data Snapshots provides prepared image maps with time sliders, available for download in five sizes. The interface requires no technical expertise: users select a dataset, adjust a slider to view changes over time, and download a pre-rendered image. The economic function here is speed of communication. When a heatwave strikes the Pacific Northwest, a media outlet can access, download, and publish a regional temperature anomaly map within minutes.
The limitation is equally clear. No customization. No export to analytical formats. No ability to combine datasets. This is data designed for consumption, not analysis. Its value lies in reducing the transaction costs of public awareness campaigns and quick policy briefings. For municipal officials who need to communicate risk to city councils without hiring data scientists, this tool bridges a critical gap.
NOAA View: Bridging Journalism and Analysis
NOAA View is a data viewer compatible with all major browsers and mobile devices, offering 60+ satellite-based datasets. Unlike Data Snapshots, this platform allows users to overlay multiple data layers—sea surface temperature, vegetation indices, aerosol concentrations—and toggle between them interactively.
The economic logic shifts here from communication to education. Journalists preparing investigative reports on drought patterns can compare historical satellite imagery with current conditions. Educators can demonstrate the seasonal progression of Arctic sea ice. The mobile compatibility is not trivial: field researchers in agriculture can access real-time soil moisture data via tablet while conducting crop surveys.
Climate Explorer: Local Decision-Making at Scale
Climate Explorer represents the most significant innovation in the catalog for economic resilience. It provides graphs and maps of historical observations and projections for every county in the contiguous United States. Users can explore past conditions and future projections, including specific metrics such as high-tide flooding days.
This tool collapses the cost barrier that traditionally prevented small municipalities and agricultural cooperatives from conducting climate risk assessments. A county agricultural extension office in Iowa can, without contracting a climate consultant, generate projections for growing degree days, precipitation frequency, and drought risk through 2090. The data is pre-processed, pre-validated, and presented at the spatial scale most relevant for local planning.
The inclusion of high-tide flooding projections is particularly significant for coastal real estate markets. Local assessors and planning boards can now quantify the number of nuisance flooding days expected by 2050 without commissioning expensive hydrological studies. This direct access to projection data fundamentally alters the information asymmetry that previously favored large institutional investors over small property owners.
Panopoly and Weather and Climate Toolkit: The Heavy Machinery
Panopoly is a visualization tool requiring Java SE 7 or 8 runtime environment, suited for intermediate to advanced users. Version 4 supports overlaying continent outlines, custom color tables, and exporting to GIF, JPEG, PNG, TIFF, PDF, or PostScript. Crucially, Panopoly 4 can export animations as AVI or MOV video, and export lon-lat map plots in KMZ format.
The Weather and Climate Toolkit (WCT) is free, platform-independent software for visualizing radar, satellite, and model data. It provides tools for background maps, animations, filtering, and data export to KMZ, Shapefile, GeoTIFF, ESRI Grid, and Gridded NetCDF. Most significantly, WCT supports 2-D and 3-D export of rendered data and isosurfaces for Google Earth.
These are the tools that enable detailed supply chain risk analysis. An agricultural commodity trader can export 3-D isosurfaces of radar-estimated precipitation to overlay on crop location maps. An insurance catastrophe modeler can export flood frequency data in Shapefile format for integration with proprietary risk models. A coastal engineer can export multi-decade sea surface temperature animations in KMZ format for visualization in Google Earth during public hearings.
The technical barrier is intentional. These users require the ability to transform data, not merely view it. The export formats—GeoTIFF for GIS specialists, NetCDF for climate scientists, KMZ for Google Earth integration—are industrial standards that enable downstream analysis in commercial and academic software ecosystems.
Technology Trends: The Browser-Based Revolution
From Desktop to Browser
The timeline from 2014 to 2021 reveals a clear technological trajectory. In 2014, Panopoly and WCT, both requiring local software installation and specific runtime environments, represented the state of the art. By 2021, Data Snapshots, NOAA View, and Climate Explorer had emerged as browser-based alternatives that require no installation, no Java runtime, and no technical configuration.
This shift has profound economic implications. Browser-based tools reduce the total cost of ownership for climate data analysis to zero for end users. No IT support for software installation. No compatibility testing across operating systems. No version control. The computational burden shifts from the user's hardware to NOAA's servers, and the user interface shifts from complex menus to intuitive sliders and dropdowns.
Integration of Projection Data
The most significant functional evolution is the integration of projection data into accessible platforms. Climate Explorer explicitly offers future projections alongside historical observations. This is not merely a convenience—it represents a fundamental shift in how climate data is consumed. Users are no longer limited to asking "what happened?" but can now ask "what is likely to happen?"
For supply chain managers in agriculture, this means the ability to query projected growing season length for specific counties through 2050. For coastal real estate developers, it means access to projected sea level rise and high-tide flooding frequencies. The democratization of projection data transfers analytical power from centralized research institutions to distributed decision-makers.
Market Pattern: Government-Led Tool Development as Infrastructure
The Absence of Commercial Alternatives
A notable feature of this ecosystem is its government-led development. NOAA, Climate.gov, and NCDC have produced these tools without direct commercial competition. The economic rationale is straightforward: the upfront investment required to build, maintain, and update such tools—particularly the data ingestion pipelines and visualization engines—is substantial, while the marginal revenue from direct sales would be negligible.
Climate data visualization is a public good. The benefits—better informed agricultural planning, more accurate insurance pricing, more resilient coastal infrastructure—accrue to society broadly, not to any single commercial entity. Private markets would underproduce these tools because they cannot capture the full value of their positive externalities.
Strategic Segmentation
The five tools represent a deliberate strategic segmentation of the user base. Data Snapshots captures the mass market of casual users and media. NOAA View captures the educational and journalistic segments. Climate Explorer captures local government and small business planning. Panopoly and WCT capture the research and engineering segments.
This segmentation is economically efficient. It prevents the oversupply of high-end functionality to users who need only basic visualization. It prevents the undersupply of technical depth to users who require advanced analytical capabilities. And it does so without requiring users to pay—the cost is borne by taxpayers, consistent with the logic of public infrastructure investment.
Long-Term Impact on Supply Chains
Agriculture
For agricultural supply chains, the availability of county-level projections through Climate Explorer enables precision adaptation. A soybean processor in Illinois can evaluate which growing regions face increasing drought risk and which may benefit from longer growing seasons. This information directly informs contract terms, storage capacity planning, and transportation routing.
The economic value lies in reducing uncertainty. Without these tools, agricultural supply chain managers rely on historical averages that may no longer be representative. With them, they can quantify the probability distribution of future conditions and adjust inventory and logistics strategies accordingly.
Insurance
The insurance industry, particularly property and casualty carriers, represents the most direct economic beneficiary of NOAA's visualization tools. The ability to export flood frequency data in Shapefile format from WCT allows insurers to update their flood risk models without purchasing proprietary data feeds.
For reinsurers, who underwrite the catastrophe risk of primary insurers, the 3-D isosurface export capability of WCT enables visualization of storm-scale radar data overlayed on exposure maps. This capability transforms raw meteorological data into a format directly usable for exposure management and capital allocation decisions.
Coastal Real Estate
For coastal real estate markets, high-tide flooding projections from Climate Explorer represent a legally significant data source. When a municipality updates its hazard mitigation plan or a developer conducts due diligence on a coastal property, the availability of NOAA-generated projection data at no cost reduces transaction costs and increases market transparency.
The long-term impact is likely to be a convergence of property valuation around NOAA's projections. As these tools become integrated into municipal planning processes, the discrepancy between current market values and projected risk exposure will become increasingly apparent. This information asymmetry—where property owners lack access to the same data as insurers and planners—is precisely what government-provided tools aim to correct.
Conclusion: Infrastructure for a Changing Climate
The evolution from static snapshots to dynamic projections represents more than technological progress. It represents the maturation of climate data visualization as a form of public infrastructure, analogous to roads, bridges, and power grids in its economic significance.
The five tools cataloged by Climate.gov—Data Snapshots, NOAA View, Climate Explorer, Panopoly, and Weather and Climate Toolkit—constitute a tiered access architecture that serves distinct user groups with distinct economic needs. The government-led development model addresses a market failure in the provision of climate data analysis tools, while the strategic segmentation ensures that both the newspaper reporter and the catastrophe modeler can access the data they need, at the technical level they require.
As climate projections improve and computational costs continue to decline, the trend toward browser-based, projection-integrated platforms will accelerate. The economic impact will cascade through supply chains that depend on climate-sensitive decisions: agricultural contract terms, insurance premiums, coastal property valuations, and municipal infrastructure investments.
The infrastructure is in place. The question is whether decision-makers—from county planners to global reinsurers—will integrate these tools into their standard operating procedures before the next climate-driven disruption tests their preparedness.