Unlocking Climate Literacy: How NOAA''s Data Resources Are Shaping the Next Generation of Decision-Makers
NOAA’s vast collection of climate data resources is not just a repository for scientists—it’s a strategic tool for education. This article explores the hidden economic logic behind making historical and projected climate data accessible to 5th-12th grade classrooms. By examining classroom-ready modules and interactive visualizations, we reveal how these resources are training a future workforce capable of navigating climate risks, driving adaptation innovation, and informing policy. From sea-level rise viewers to carbon dioxide trends, the data trains students to think like analysts—transforming raw numbers into actionable insights. We argue that this educational pipeline is a long-term investment in climate resilience, with ripple effects across supply chains, insurance markets, and urban planning.
Unlocking Climate Literacy: How NOAA's Data Resources Are Shaping the Next Generation of Decision-Makers
**Introduction: More Than Just Data – A Strategic Educational Asset**
For decades, the National Oceanic and Atmospheric Administration (NOAA) has been best known as the federal agency behind weather forecasts, ocean monitoring, and climate research. Its vast archives of historical and projected climate data—spanning temperature records back to 1850, sea-level rise scenarios through 2100, and drought indices covering multiple continents—are technical resources that scientists and policy analysts rely on daily. Yet a quieter, more transformative shift is underway: NOAA is systematically repackaging these datasets for K-12 classrooms, creating an educational pipeline that may prove as consequential as any single research study.
The core axis of this shift is a move from pure science communication to workforce development. Students who today manipulate interactive maps of carbon dioxide trends or explore sea-level rise simulations are not merely learning science facts; they are training to become the analysts, planners, and decision-makers of tomorrow. When a 10th grader uses the Climate Explorer to compare historical precipitation patterns with projections for 2050, they are building the same cognitive muscles that climate risk officers use in insurance companies and supply chain managers apply in global logistics. The economic logic behind this is straightforward: early exposure to real-world data reduces the learning curve for future climate-related careers and accelerates the adoption of data-driven decision-making across every sector exposed to climate volatility.
[IMAGE: A split-screen image: left side shows a NOAA climate data dashboard with sea-level rise and carbon dioxide trends; right side shows a classroom of diverse students working on a digital lesson, connecting the data to real-world impact.]
**The Hidden Logic: From Data Literacy to Economic Resilience**
Unlike breaking news or rapidly evolving weather events, the educational value of NOAA’s climate data resources compounds over years, not hours. The datasets are continuously updated—the Climate Explorer, for example, incorporates historical observations from 1950 and downscaled projections extending to 2090—but the real return on investment appears in the slow build of human capital. This is a long-term trend analysis, not a fast-response story. The market pattern is unmistakable: as climate risks intensify across agriculture, insurance, coastal real estate, and energy, demand for professionals who can interpret historical trends and future projections will surge. NOAA, by embedding its data into classroom modules, is effectively seeding that talent pool at scale.
Consider the supply chain implications. Future logistics managers trained on Drought data and projections—which cover U.S. conditions from 2010 to 2018 and global patterns from 2013 to 2018, with forecasts stretching to 2095—will be equipped to anticipate water shortages that disrupt crop yields or shipping routes. A student who learns to visualize drought probability maps today will, a decade from now, make sourcing decisions that reduce climate-related disruptions. The same logic applies to coastal supply chains: a manager who understands sea-level rise scenarios for the Gulf Coast will avoid locating distribution centers in flood-prone zones. This is not theoretical; companies like Walmart and Maersk have already begun integrating climate projections into their risk frameworks, and the next generation of analysts trained on NOAA’s open data will enter the workforce with a head start.
[IMAGE: A diagram showing a feedback loop: NOAA data → classroom modules → skilled graduates → climate-resilient industries → reduced economic losses. Arrows connect each stage in a circular flow.]
The educational pipeline also reduces the cost to employers. When students graduate with hands-on experience using the same data tools that professionals rely on—such as the Sea Level Rise Viewer or the Climate Mapping for Resilience and Adaptation portal—companies spend less on retraining. This hidden subsidy to the private sector is a deliberate feature of NOAA’s education strategy, though it often goes unrecognized in public discussions of climate adaptation funding.
**Classroom-Ready Modules: Bridging the Gap Between Raw Data and Actionable Knowledge**
Translating petabyte-scale climate datasets into lessons that engage 5th through 12th graders is no small challenge. NOAA’s education office has developed a suite of carefully designed modules that transform complex data into inquiry-based learning experiences. Two flagship programs illustrate the approach: Climate & Data ACLIPSE (grades 6-12) and Data in the Classroom (grades 5-12). Both use real-time and historical NOAA data to guide students through structured investigations—analyzing temperature anomalies, examining coral bleaching patterns, or comparing drought severity across decades.
One particularly innovative module is *Where in the World is Leo DelMar?* (grades 9-12), which gamifies sea-level rise understanding. Students take on the role of a scientist tracking a drifting buoy while simultaneously analyzing local sea-level trends and projections. The module requires them to interpret tide gauge data, overlay satellite imagery, and make predictions about coastal inundation. By turning data analysis into a narrative puzzle, it keeps students engaged while developing quantitative reasoning skills.
Another critical resource is the Drought data and projections module (grades 9-12), which connects students to both historical U.S. drought records (2010-2018) and the global drought timeline (2013-2018) while introducing forecast data that extends to 2095. Students are asked to identify regions where drought risk is increasing, compare the rate of change across different continents, and consider how such trends might affect food production and water resource management. The module explicitly trains students to distinguish between short-term weather variability and long-term climate signals—a distinction essential for accurate risk assessment in any future career.
[IMAGE: Screenshot of the "Data in the Classroom" interface showing a student exploring a time series of atmospheric carbon dioxide from Mauna Loa, with interactive sliders to change the time range and overlay temperature data.]
These modules embed critical thinking at every step. Students are not given conclusions; they are asked to visualize, analyze, and interpret data themselves. For example, a lesson on sea-level rise might require students to generate a graph of local tide gauge measurements, calculate the rate of change, and then compare it with global averages. They must then evaluate the uncertainty in projections—a skill that is directly transferable to any data-dependent profession. By the time students complete a module, they have essentially performed the same analytical workflow that climate consultants use when advising municipalities on adaptation investments.
**Interactive Visualizations: Making Projections Tangible**
Beyond structured modules, NOAA offers a suite of interactive visualization tools that teachers can incorporate directly into lessons. The Sea Level Rise Viewer, for instance, allows users to toggle future scenarios and see how different amounts of sea-level rise will affect coastal communities. A student in Miami can zoom to their own neighborhood, select a projection of 2 feet of rise by 2050, and see which streets would be underwater. The embodied experience of that visualization—seeing familiar landmarks vanish under a blue overlay—creates a visceral understanding that no textbook can replicate.
Similarly, the Climate Explorer provides a dashboard that displays historical temperature and precipitation data alongside projections for two future emissions scenarios. Students can compare how their hometown’s summer heat index might shift under a moderate (RCP 4.5) versus high-emissions (RCP 8.5) pathway. This direct engagement with future projections is a cornerstone of climate literacy because it moves the conversation from abstract averages to concrete, local consequences.
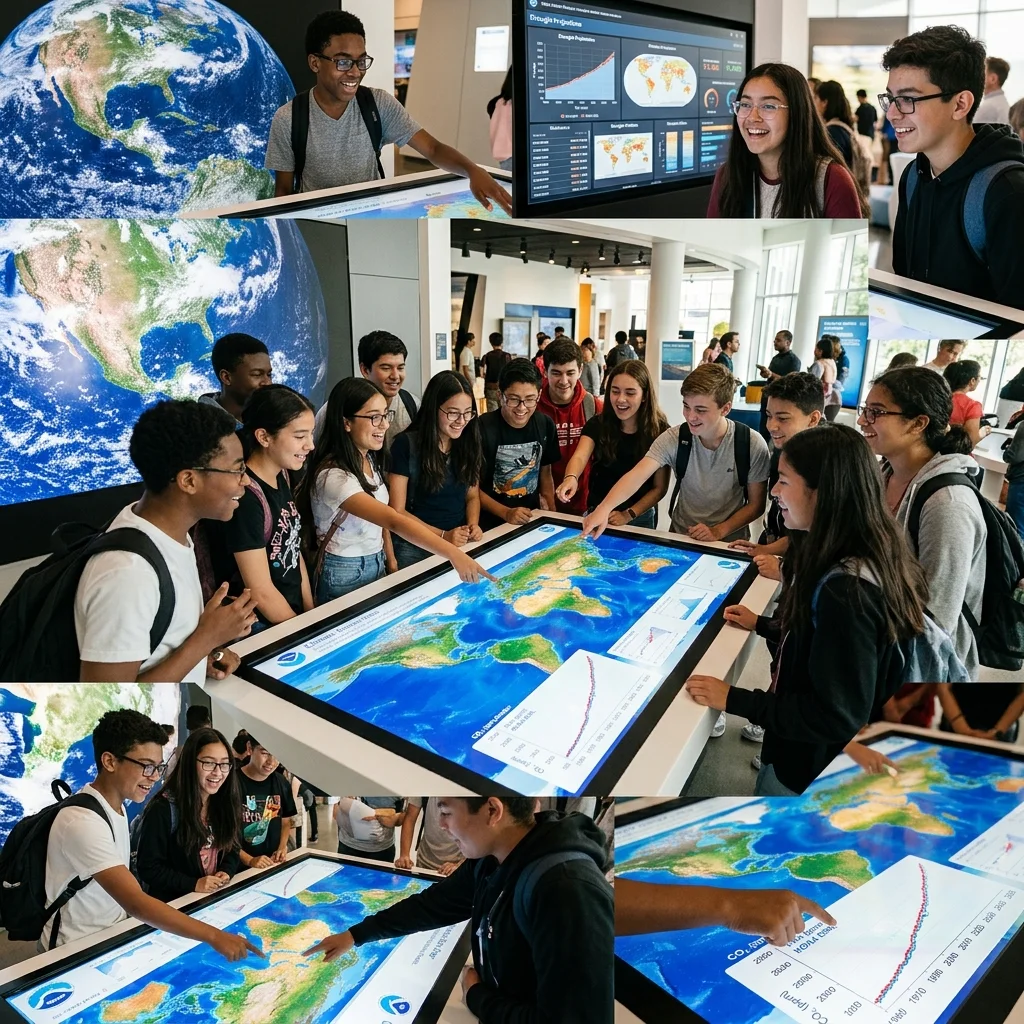
[IMAGE: A dynamic collage showing a diverse group of middle and high school students gathered around a large interactive touchscreen displaying a colorful NOAA climate map with sea-level rise simulations and carbon dioxide trend lines. In the background, satellite imagery of Earth and a digital dashboard showing drought projections. No text or watermarks, realistic photo style, bright and hopeful atmosphere.]
The carbon dioxide trend visualizations—built on the iconic Keeling Curve—are another staple. Students can examine the seasonal sawtooth pattern of CO₂ concentrations, observe the accelerating upward trend, and overlay temperature anomaly data to explore correlations. The practice of manipulating time scales and data layers trains the eye to see patterns that are invisible in static graphs. This is climate data visualization at its pedagogical best: it turns raw numbers into a narrative of change.
**Conclusion: A Long-Term Investment in Resilience**
The argument that NOAA’s education resources are a strategic economic asset rests on a simple premise: a climate-literate workforce is a resilient workforce. Every student who learns to analyze drought projections or sea-level rise scenarios today is one less employee who will need remedial training tomorrow. The ripple effects extend far beyond classrooms. When these students enter supply chain management, they will make better sourcing decisions based on precipitation forecasts. When they join insurance firms, they will price risk more accurately using historical and projected data. When they work in urban planning, they will design infrastructure that accounts for future flood risks.
The NOAA education pipeline is not a quick fix; it is a slow, compounding investment that takes a decade or more to yield visible returns. But as climate-related disruptions mount—crop failures, coastal inundation, supply chain breakdowns—the value of a workforce that can interpret and act on climate data will only increase. By making its data resources accessible to 5th-12th grade classrooms, NOAA is not just fulfilling its mission to educate the public. It is quietly building the human capital that will define how successfully the world adapts to a changing climate.
The ultimate beneficiaries are not only the students who gain analytical skills, but also the industries, communities, and economies that will rely on their future decisions. In that sense, every interactive map created, every module downloaded, and every student who thinks like an analyst represents a down payment on climate resilience. The data itself is static; the education is what turns it into action.