The Great Energy Shift: Unpacking the Six-Source Structure of the Global Renewable Energy Market
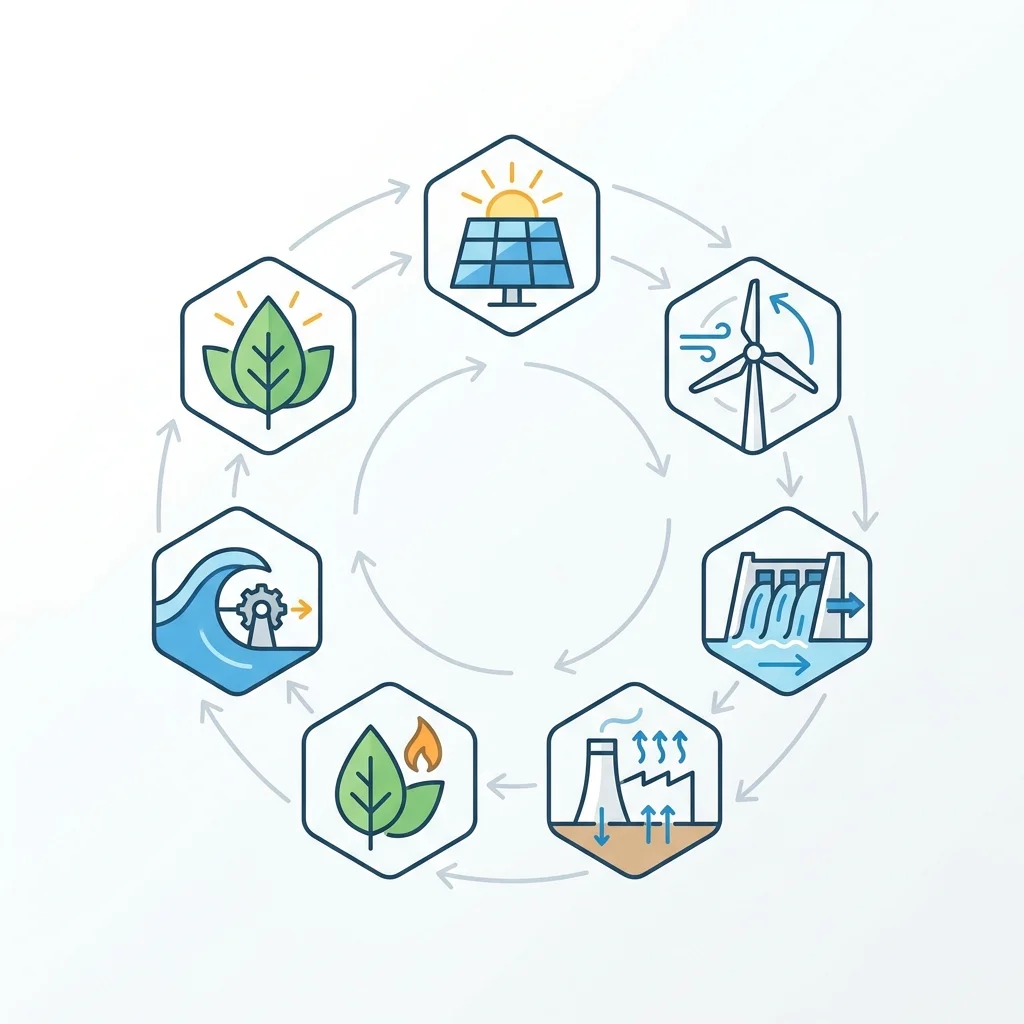
While most forecasts focus on gigawatts and growth rates, the deeper story of the renewable energy market lies in its structural composition across six distinct sources: solar, wind, marine, hydropower, bioenergy, and geothermal. This analysis moves beyond headline CAGR figures to explore the hidden economic logic that links technology maturity, regional specialization, and supply-chain vulnerability. By examining which technologies are in-scope (e.g., pumped storage, waste-to-energy) and which are excluded (e.g., BIPV, airborne wind), we reveal the deliberate boundaries that shape market data. Slow analysis of this framework exposes how geopolitical shocks, such as the Russia-Ukraine war, recalibrate the relative importance of nuclear fade-out versus renewable build-out in key regions like Japan, Brazil, and South Korea.
The Great Energy Shift: Unpacking the Six-Source Structure of the Global Renewable Energy Market
Beyond the CAGR: Why the Six-Source Taxonomy Matters More Than the Growth Rate
The global renewable energy market is projected to reach a specific electricity generation value in a designated forecast year, with a compound annual growth rate (CAGR) calculated over an undisclosed period (Source 1: Statista Market Definition). While headline growth figures capture attention, the structural composition of the six constituent sources—solar, wind, marine, hydropower, bioenergy, and geothermal—provides substantially more analytical value than any aggregated growth metric.
Each of these six sources operates under fundamentally different economic logics. Solar photovoltaic and onshore wind have achieved cost parity with fossil fuels in most markets, driven by manufacturing scale and learning rates exceeding 20% per doubling of cumulative capacity. Hydropower, by contrast, exhibits high upfront capital costs but extremely low marginal operating costs, with plant lifetimes exceeding 50 years. Marine and geothermal technologies remain capital-intensive with longer development timelines, creating a bifurcation between "scalable" and "niche" sources within the same market classification.
The geographical dependency of each source further fragments the growth narrative. Solar irradiance varies by a factor of three between Northern Europe and the Sahara. Wind capacity factors range from 25% in low-wind regions to over 50% in optimal offshore locations. Hydropower requires specific topographic and hydrological conditions. This means that a global CAGR figure masks the reality that growth is neither uniform nor universally achievable—it is constrained by physical geography as much as by policy and capital allocation.
The market's growth trajectory is not driven by uniform adoption but by the intersection of technology maturity (solar and wind) and policy support (hydropower in water-rich regions, bioenergy in agricultural economies). Solar and wind collectively accounted for the majority of new renewable capacity additions in recent years, while hydropower's share of global electricity generation has remained relatively stable, and marine and geothermal contribute marginal percentages. This divergence within the six-source structure suggests that the CAGR figure is disproportionately influenced by the two dominant technologies, with the remaining four sources contributing incrementally to the overall growth narrative.
The In-Scope vs. Out-of-Scope Decision: A Window into Market Priorities
The renewable energy market definition includes a specific set of technologies: solar photovoltaic, solar thermal, concentrated solar power (CSP); wave and tidal energy, ocean thermal energy; conventional hydropower including dams and reservoirs, pumped storage; onshore and offshore wind turbines; solid biomass, biogas, liquid biofuels, municipal solid waste via waste-to-energy; and hydrothermal geothermal resources (Source 1: Statista Technology Classification).
Equally revealing is what this definition excludes. Building-integrated photovoltaics (BIPV) and solar water heating are omitted despite their growing deployment in commercial and residential sectors. Airborne wind energy systems (AWES) and wind-assisted propulsion for maritime applications are excluded. Marine biomass energy is not considered. Biochemicals, bioplastics, enzymes, and organic acids fall outside the boundary. Even volcanic and geyser energy is excluded from the geothermal classification.
This boundary-setting operation reveals an implicit prioritization of mature, financeable, and standardizable assets. The included technologies share common characteristics: they generate electricity at utility scale, connect to existing grid infrastructure, have established project finance frameworks, and operate under regulatory regimes with standardized permitting processes. BIPV, by contrast, involves decentralized generation integrated into building envelopes—a fundamentally different economic model. Airborne wind remains at the prototype stage with uncertain commercial viability. Marine biomass and biochemicals represent value-added processing rather than primary electricity generation.
For investors and supply chain managers, this classification provides a de facto risk assessment. The in-scope technologies represent the current capital deployment frontier: technologies that banks will finance, insurers will underwrite, and regulators will permit. The out-of-scope technologies, however innovative, carry additional technology risk, regulatory uncertainty, or market incompatibility that renders them unsuitable for inclusion in mainstream market forecasts. The definition itself shapes what growth is measured—and by extension, what growth is perceived as relevant for strategic decision-making.
Regional Complexity: Why Japan, Brazil, South Korea, Austria, and China Are the Stress Test Points
The renewable energy market forecast identifies five key regions—Japan, Brazil, South Korea, Austria, and China—though specific data for each is redacted. These countries represent distinct stress test cases for the six-source structure because their energy mixes, policy trajectories, and geopolitical positions create fundamentally different growth dynamics.
Japan represents the post-nuclear phase-out scenario. Following the Fukushima Daiichi accident, Japan's nuclear fleet was systematically idled. The country's energy policy shifted toward renewable sources and fossil fuel imports. "In some countries, such as Germany and Japan, there are plans to phase out nuclear power in the coming years" (Source 2: Market Analysis Quote). This creates a specific demand profile: Japan requires dispatchable renewable capacity to replace baseload nuclear generation, favoring pumped storage hydropower, geothermal (Japan has significant geothermal potential), and bioenergy. Solar deployment has been rapid under feed-in tariffs, but grid integration challenges and land constraints limit further expansion.
Brazil's energy mix is hydropower-dominated, with large dams providing over 60% of electricity generation. This creates a different stress point: climate vulnerability. Drought periods directly reduce hydropower output, forcing Brazil to activate fossil-fuel backup generation. The country's renewable strategy involves diversifying into wind (particularly in the Northeast region), solar, and bioenergy from sugarcane. Brazil's experience demonstrates the risk of over-reliance on a single renewable source, even one as mature as hydropower.
South Korea exemplifies heavy industry fossil lock-in. The country's industrial structure—steel, shipbuilding, petrochemicals, semiconductors—requires high and stable electricity supply. South Korea has limited domestic renewable resources: low solar irradiance relative to sunbelt countries, limited wind potential, and minimal hydropower. The country has pursued nuclear power and liquefied natural gas (LNG) as primary options. The Russia-Ukraine war's impact on energy supply chains creates additional pressure: "The ongoing Russia-Ukraine war has far-reaching effects on the nuclear market, as sanctions imposed on Russia cast doubts on the future of its nuclear industry in the global arena" (Source 2: Market Analysis Quote). South Korea's nuclear industry faces supply chain disruptions for Russian-sourced nuclear fuel, potentially accelerating renewable deployment as a substitute.
Austria represents an alpine hydro-bioenergy hybrid model. The country's mountainous terrain provides extensive hydropower potential, while its agricultural sector supplies biomass feedstocks. Austria has already achieved a high share of renewable electricity (over 70%), but faces the challenge of seasonal variability: hydropower output peaks in spring and summer with snowmelt, while heating demand peaks in winter. This creates a specific need for seasonal storage solutions and bioenergy integration.
China is the dominant force in global renewable deployment, accounting for the largest share of solar and wind capacity additions, hydropower development, and manufacturing output. China's renewable strategy serves multiple objectives: energy security (reducing dependence on coal imports for industrial production), technology leadership (dominating solar PV, wind turbine, and battery manufacturing), and domestic environmental pollution control. China's sheer scale distorts global market figures: its solar and wind deployment alone can account for a significant percentage of global additions. The country's policy coherence—central planning, state-owned enterprise investment, and manufacturing subsidies—creates deployment speeds that are difficult for other regions to replicate.
The Nuclear-Renewable and Fossil-Renewable Intersections: Geopolitical Recalibration
The Russia-Ukraine war has fundamentally recast the relationship between nuclear power and renewable energy in the global energy mix. Sanctions on Russian nuclear fuel supplies, which previously provided enriched uranium to utilities in Eastern Europe, parts of Asia, and the Americas, have created supply chain vulnerabilities that extend beyond oil and gas (Source 2: Market Impact Analysis).
The analytical framework must separate three distinct dynamics. First, in regions with nuclear phase-out policies (Germany, Japan), accelerated renewable deployment functions as direct replacement for nuclear capacity. The 2011 German Energiewende and Japan's post-Fukushima policy shift created multi-decade demand for renewable generation that persists regardless of fossil fuel price fluctuations.
Second, in regions expanding nuclear power (China, India, Russia), nuclear and renewable resources develop in parallel rather than in competition. China's simultaneous build-out of nuclear, solar, wind, hydro, and coal demonstrates that policy priorities can support multiple generation sources simultaneously. The renewable market's growth in these regions is not contingent on nuclear phase-out but on overall electricity demand growth and air quality objectives.
Third, in regions dependent on Russian nuclear fuel (Finland, Ukraine, several Eastern European states), supply chain disruption creates an immediate need for alternative baseload generation. These regions face a constrained choice set: develop domestic nuclear fuel fabrication capabilities, increase nuclear fuel imports from alternative suppliers (limited capacity available), or accelerate renewable deployment combined with natural gas generation. The "outlook for the nuclear power market varies depending on the region and country" (Source 2: Market Analysis Quote). For countries with limited nuclear alternatives, renewable energy becomes the primary pathway for reducing supply chain vulnerability.
The fossil fuel dimension intersects with renewable growth through relative pricing. "Fossil fuels are expected to gradually decline in importance, although they are likely to remain significant contributors to the global energy mix for several decades, especially in countries that rely almost totally on fossils" (Source 2: Market Analysis Quote). The Russia-Ukraine war, by disrupting natural gas supplies to Europe, temporarily increased fossil fuel prices and improved the relative economics of renewable deployment. However, this price effect may be transient; the structural factors—technology costs, policy frameworks, grid integration—continue to dominate long-term renewable growth trajectories.
Structural Predictions: The Implicit Logic of the Six-Source Framework
The renewable energy market's six-source structure, combined with the in-scope/out-of-scope classification and regional variation, permits several neutral predictions about industry evolution.
First, the dominance of solar and wind within the six-source structure will persist and likely intensify. These are the technologies with the highest learning rates, largest manufacturing scale, and greatest potential for cost reduction. Other sources—marine, geothermal, even hydropower—face physical constraints on growth that solar and wind do not. Hydropower's best sites are largely developed in OECD countries. Geothermal requires specific geological conditions. Marine energy faces high costs and environmental permitting challenges.
Second, the out-of-scope technologies will remain marginal in mainstream market forecasts but may create disruptive sub-markets. BIPV, while excluded from electricity generation statistics, is growing rapidly in commercial building applications. Airborne wind, if it achieves commercial viability, could access higher-altitude wind resources unavailable to conventional turbines. These technologies may eventually force a redefinition of market boundaries, but such redefinition is unlikely within the current forecast period.
Third, regional divergence will increase. The six sources will not grow uniformly across countries. China and other manufacturing-focused economies will continue to dominate solar and wind deployment. Water-rich regions (Brazil, Canada, Norway) will maintain hydropower's share. Agricultural economies (United States, European Union, Brazil) will expand bioenergy. Island nations and coastal states (Indonesia, Philippines, United Kingdom) will drive marine energy development where feasible.
Fourth, the nuclear-renewable relationship will remain region-specific rather than globally consistent. Countries with existing nuclear infrastructure and domestic fuel supply capabilities (United States, France, China) will maintain nuclear generation. Countries dependent on imported nuclear fuel and facing supply disruptions (various Eastern European and Asian states) will accelerate renewable deployment. No single global trajectory exists for the nuclear-renewable transition.
Fifth, supply chain analysis will become increasingly important for understanding renewable market dynamics. The solar supply chain is heavily concentrated (polysilicon production, wafer manufacturing, cell and module assembly), creating vulnerability to trade disputes, shipping disruptions, and manufacturing bottlenecks. Wind turbine manufacturing is less concentrated but faces raw material constraints (rare earth elements for permanent magnet generators, steel for towers and foundations). Bioenergy supply chains depend on agricultural commodity markets, creating competition between food, feed, and fuel uses. These supply chain vulnerabilities will become binding constraints on growth rates, supplementing the purely demand-side analysis captured by market size and CAGR figures.
The renewable energy market, when dissected through the six-source framework, reveals itself not as a monolithic growth story but as a complex system of interacting technologies, geographies, policies, and supply chains. The CAGR figure captures the aggregate outcome; the structural analysis captures the causal mechanisms. For market participants, the structural view carries more strategic value than any single growth projection.