Climate Tech Market Surge vs. Rising Emissions: The Economic Paradox of Decarbonization
The climate technology market is expanding at record pace, led by renewables ($881B) and electric vehicles (21.7% CAGR), yet global CO₂ emissions rose 6.5% in 2021 to 37 billion metric tons. This article dissects the hidden economic logic behind this paradox, revealing that current investment volumes are insufficient to meet IPCC’s 45% reduction target by 2030. Using Swiss Re’s 18% GDP loss projection and WHO’s mortality data, we uncover a supply-chain and policy gap that threatens to delay net-zero by decades. A slow-analysis deep audit of sector-level CAPEX versus emission curves offers a roadmap for aligning market growth with planetary boundaries.
Climate Tech Market Surge vs. Rising Emissions: The Economic Paradox of Decarbonization
**By Senior Technical/Financial Audit Journalist**
---
The Decoupling Illusion: Strong Market Growth, Weak Emission Reduction
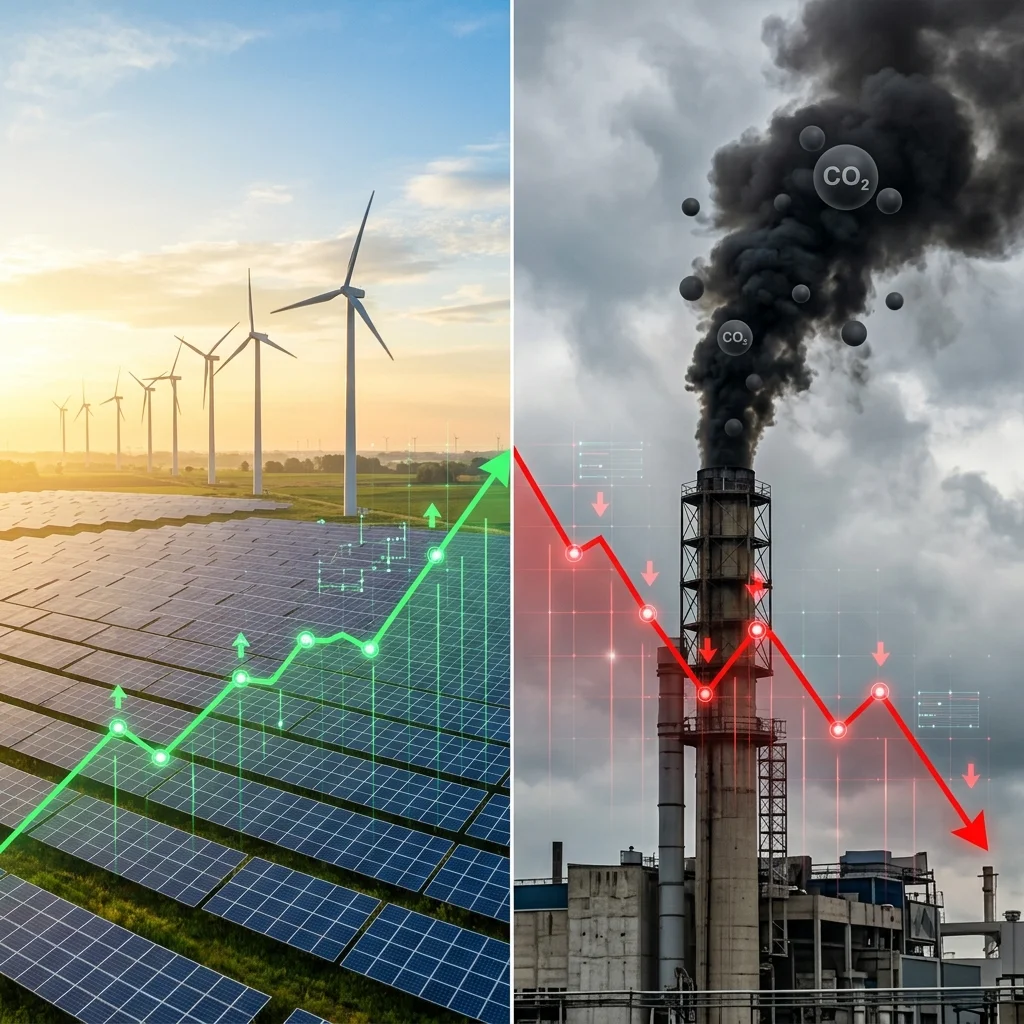
The global climate technology market is experiencing its most aggressive expansion on record. Renewable energy, the sector's dominant segment, has reached a market valuation of $881 billion, growing at a compound annual growth rate (CAGR) of 9.6% from 2021 through 2028 (Source 1: Market Analysis Data). Electric vehicle and battery technology, the fastest-growing sub-sector, is expanding at 21.7% CAGR, with a current market value of $246 billion (Source 1: Primary Market Data).
These metrics suggest a world rapidly transitioning away from carbon-intensive infrastructure. The data, however, reveals a stark contradiction. Global CO₂ emissions reached 37 billion metric tons in 2021, representing a 6.5% increase from the pandemic-induced lows of 2020 (Source 1: Emissions Tracking Data). This absolute increase occurred despite $56 billion in U.S. climate technology investment alone during the same calendar year (Source 1: Investment Flow Analysis).
The Intergovernmental Panel on Climate Change (IPCC) has established that limiting global warming to 1.5°C requires a 45% reduction in CO₂ emissions from 2010 levels by 2030, with net-zero attainment by 2050 (Source 2: IPCC Assessment Report). Current market trajectories are not producing the necessary emission curve inflection. The core economic question becomes: why is massive capital deployment failing to generate proportionate environmental outcomes?
The answer lies in the arithmetic of scale. Global greenhouse gas emissions from human activities totaled 49 billion tons of CO₂ equivalent in 2020 (Source 2: Emissions Inventory Data). The energy sector alone contributes 73% of these emissions (Source 2: Sector Attribution Analysis). A $56 billion investment, while substantial in absolute terms, represents approximately 0.25% of U.S. GDP—an allocation insufficient to restructure an energy system that took over a century to build.
---
Sector-by-Sector: Which Climate Tech Segments Are Actually Moving the Needle?
Disaggregating the climate technology market reveals significant variation in both financial performance and emission reduction potential. Each sector exhibits distinct capital efficiency profiles relative to its carbon abatement capacity.
Energy Efficiency: The Largest Non-Renewable Segment The energy efficiency market, valued at $279 billion with an 8.9% CAGR, represents the most direct pathway to emission reduction (Source 1: Market Segmentation Data). Unlike generation-side investments, efficiency improvements deliver immediate demand reduction. However, adoption bottlenecks in industrial supply chains—particularly in cement, steel, and chemical manufacturing—limit deployment velocity. Industrial processes require capital-intensive retrofits with payback periods that frequently exceed corporate planning horizons.
Circular Economy: High Growth, Low Penetration Circular economy technologies, valued at $45 billion with an 11.1% CAGR, address waste-to-resource conversion (Source 1: Market Segmentation Data). Global waste management markets are projected to reach $484 billion by 2028 (Source 1: Industry Projections). The sector's emission reduction potential is substantial but constrained by collection infrastructure gaps, recycling technology limitations, and the current economic advantage of virgin material extraction.
Carbon Capture: The Critical Gap Carbon capture, utilization, and storage (CCUS) technology carries a market value of only $2.3 billion despite a 19.3% CAGR (Source 1: Market Segmentation Data). This segment is essential for addressing hard-to-abate industrial emissions, yet current investment levels are orders of magnitude below what the IEA estimates is required—approximately $1.2 trillion in cumulative CCUS investment by 2050 to meet net-zero pathways (Source 3: International Energy Agency Modeling).
Sustainable Agriculture: Addressing 24% of Emissions Agriculture accounts for 24% of global greenhouse gas emissions (Source 2: Sector Attribution Analysis). The sustainable agriculture market, valued at $15 billion with a 7.4% CAGR, remains severely undercapitalized relative to this contribution (Source 1: Market Segmentation Data). Scalability challenges persist: regenerative farming practices require multi-year transition periods during which yields may decline, creating adoption resistance among risk-averse agricultural producers.
Electric Vehicles: The High-Velocity Segment EV sales are projected to reach 30 million units by 2030, up from 2.5 million in 2020 (Source 1: Market Projections). This represents a twelve-fold increase in a single decade. However, the transportation sector accounts for only 16% of global emissions. Even if every new vehicle sold by 2035 is electric—a target several countries have adopted—the existing 1.4 billion internal combustion engine vehicles currently in operation will continue emitting for their average 12-15 year lifespan. The replacement cycle creates a structural delay between investment and emission reduction.
Water Management and Climate Adaptation Water management technologies ($36 billion, 6.8% CAGR) and climate adaptation technologies ($25 billion, 7.3% CAGR) represent defensive investments (Source 1: Market Segmentation Data). These sectors address the consequences of climate change rather than its root causes, indicating that capital markets are already pricing in some degree of climate disruption.
---
The Hidden Cost of Delay: GDP at Risk and Human Toll
The economic consequences of insufficient decarbonization velocity are quantifiable with increasing precision. A comprehensive Swiss Re study projects an 18% reduction in global gross domestic product by 2050 in the absence of mitigation measures (Source 4: Insurance Sector Economic Modeling). This translates to an annual loss exceeding $15 trillion—a figure that dwarfs current climate technology investment by multiple orders of magnitude.
The human cost compounds the economic calculation. The World Health Organization projects 250,000 additional climate-related deaths annually between 2030 and 2050 from heat stress, malnutrition, malaria, and diarrhea (Source 5: WHO Environmental Health Assessment). These mortality projections do not include indirect effects from displacement, conflict over resources, or healthcare system strain.
In the United States, extreme weather events caused over $145 billion in damages during 2021 alone (Source 1: Disaster Loss Data). This figure represents a 2.6x multiple of total U.S. climate tech investment for the same year, suggesting that current spending levels merely keep pace with incurred losses rather than building the infrastructure necessary to prevent future damage.
The Swiss Re analysis embeds a critical economic insight: the cost of inaction is not linear but exponential. Early-stage mitigation investments face lower capital requirements than delayed interventions, as temperature-dependent tipping points trigger cascading economic disruptions. The 18% GDP reduction projection assumes a 3°C warming scenario by 2100—the current trajectory under existing policy commitments (Source 2: IPCC Scenario Modeling).
---
Why Current Investment Levels Fall Short of the IPCC 2030 Target
The gap between current capital allocation and the investment required for the IPCC 2030 target reveals structural deficiencies in the decarbonization financing model.
The Investment Gap The International Energy Agency and IPCC estimate that annual global investment of $4-5 trillion will be required by 2030 to maintain a 1.5°C-aligned pathway (Source 3: IEA/IPCC Joint Assessment). Current global climate technology investment—including public, private, and multilateral sources—is approximately $1.2 trillion annually, representing a shortfall of 70-75%.
The U.S. climate tech investment of $56 billion in 2021, while the largest single-country allocation, represents only 0.25% of GDP. For context, the U.S. spent approximately 4.5% of GDP on defense in 2021. The discrepancy between threat perception and resource allocation suggests either a structural underestimation of climate risk severity or a mispricing of mitigation benefits versus current consumption.
Supply-Chain Bottlenecks Three critical supply-chain constraints are preventing investment from translating into emission reduction:
**Critical Mineral Shortages:** EV batteries require lithium, cobalt, nickel, and rare earth elements. Current mining capacity is insufficient to support projected 2030 demand for 30 million EV units annually. Lithium extraction lead times average 5-7 years from exploration to production, creating a structural supply constraint that will persist through 2030.
**Grid Interconnection Delays:** Renewable energy projects in major economies face interconnection queue wait times averaging 3-5 years. In the United States, the interconnection backlog exceeds 1,000 gigawatts of planned capacity—more than the entire current U.S. generating fleet. This administrative bottleneck converts theoretical investment into delayed deployment.
**Permitting and Siting:** Carbon capture and storage hubs require geological storage site characterization, regulatory approval, and pipeline infrastructure. No single CCUS project in history has progressed from concept to operation in under seven years. Current project pipelines are insufficient to meet even 10% of the storage capacity required by 2050.
The Time-Value of Carbon A critical analytical framework often omitted from climate finance discussions is the time-value of carbon. Emissions reductions achieved earlier carry disproportionately greater climate benefits than equivalent reductions achieved later, due to the cumulative nature of atmospheric CO₂ concentrations. The IPCC's 45% reduction target by 2030 is not an arbitrary milestone but a physical constraint: exceeding this threshold triggers feedback loops—permafrost melt, forest dieback, ice sheet instability—that are irreversible on human timescales.
Current investment trajectories may achieve 2030 targets in certain sectors (renewable electricity generation) while failing in others (industrial decarbonization, agricultural emissions). This sectoral asymmetry creates the impression of progress while insufficiently addressing the structural sources of approximately half of global emissions.
---
Conclusion: The Economic Recalibration Imperative
The climate technology market's growth trajectory is historically unprecedented, yet it is insufficient relative to the emission reduction requirements identified by the IPCC's physical science. This is not a market failure in the traditional sense, but a structural mismatch between the pace of capital deployment and the acceleration of climate system responses.
Three observations emerge from this analysis:
**First,** the 18% GDP reduction projection by Swiss Re represents an upper-bound estimate of economic loss that assumes no mitigation acceleration. Every year of delayed investment increases the probability-weighted loss, as irreversible tipping points create nonlinear damage functions.
**Second,** the supply-chain constraints identified—critical minerals, grid interconnection, and permitting—represent tractable policy problems. Technical solutions exist; the bottleneck is administrative and regulatory velocity. Markets cannot resolve these constraints without complementary policy frameworks that accelerate project approval timelines.
**Third,** the sectoral investment patterns reveal that capital markets are pricing decarbonization opportunities with a 10-15 year discount horizon, while the climate system operates on a 30-50 year accumulation cycle. This temporal mismatch creates systematic underinvestment in long-duration assets—carbon capture infrastructure, grid modernization, industrial retrofit programs—that are essential for 2050 net-zero targets.
The climate technology market will continue expanding at double-digit growth rates. Whether this expansion aligns with planetary boundaries depends not on total investment volume but on the structural efficiency of capital allocation, supply-chain velocity, and the resolution of the temporal discount conflict between financial markets and physical systems.
The paradox of rising emissions alongside booming climate tech investment is not evidence of market irrationality. It is evidence that current market incentives, policy frameworks, and infrastructure systems are misaligned with the physical reality of atmospheric CO₂ accumulation. Correcting this misalignment represents the most consequential economic challenge of the next decade.