Beyond Subsidies: The Hidden Profitability Shift in Global Renewable Energy Markets
Renewable energy markets have entered a new phase where falling technology costs and maturing project finance are reshaping the economic logic of the entire energy sector. This article explores the underlying shift from policy-driven growth to market-driven profitability, the rebalancing of supply chains away from commodity volatility, and the emerging investment strategies that anticipate grid integration challenges. By analyzing the hidden leverage points in capital allocation, capacity factors, and long-term power purchase agreements, we reveal why the next decade will belong to developers who can manage risk rather than chase subsidies.
Beyond Subsidies: The Hidden Profitability Shift in Global Renewable Energy Markets
Introduction: The End of the Subsidy Era
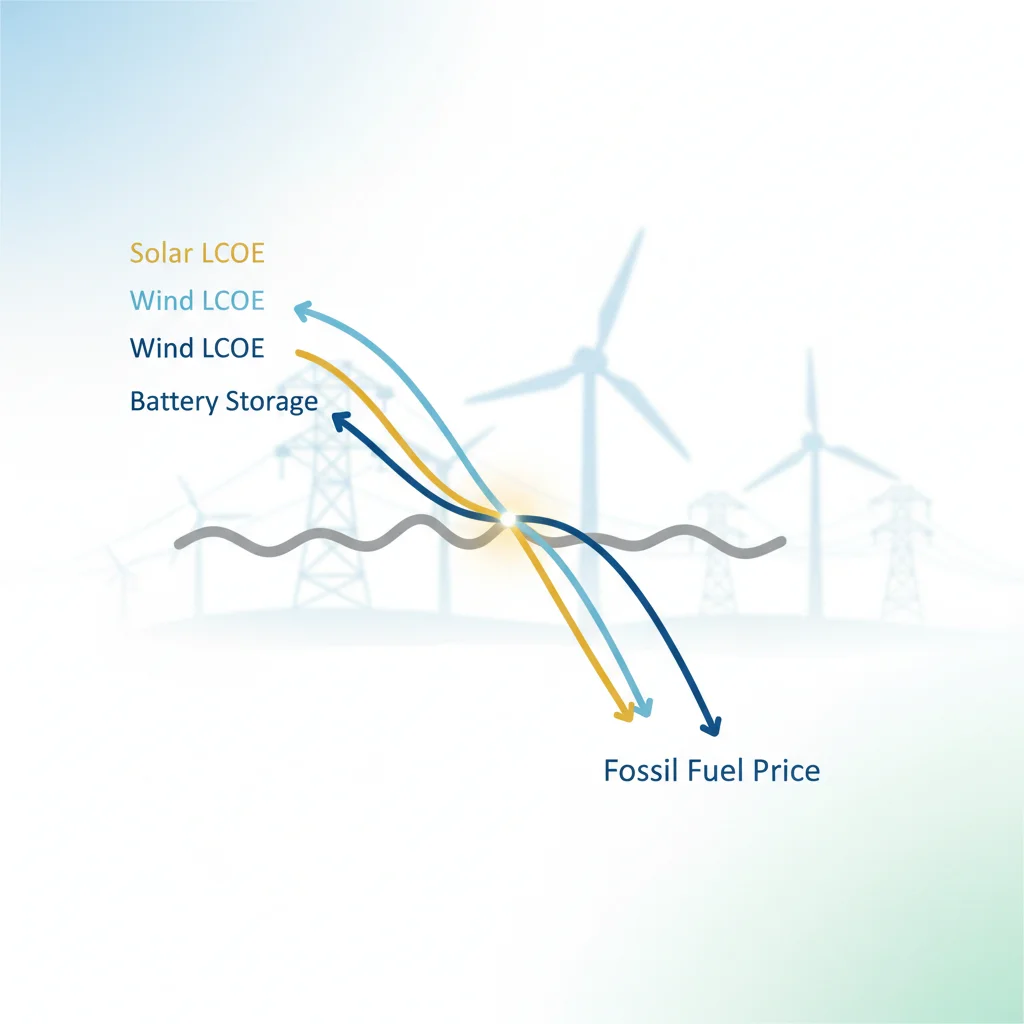
For the past decade, global renewable energy deployment was driven by a simple equation: build capacity, collect subsidies. Feed-in tariffs in Europe, production tax credits in the United States, and renewable portfolio standards across Asia created a stable, policy-backed revenue stream that made project economics predictable, if not always efficient. But that era is ending. In 2024, unsubsidized solar photovoltaic (PV) and onshore wind projects are cheaper than new coal and gas plants in regions accounting for over 80% of global electricity demand, according to the International Renewable Energy Agency (IRENA). The Levelized Cost of Energy (LCOE) for utility-scale solar has fallen by nearly 90% since 2010, and onshore wind by 70%.
The core insight is this: the renewable energy market has shifted from a "policy push" to a "technology pull." Profitability no longer depends on legislative support or the generosity of government coffers. Instead, it hinges on operational excellence—optimizing capacity factors, managing curtailment risk, and securing bankable power purchase agreements (PPAs). The next decade will not reward developers who chase subsidies; it will reward those who manage risk with surgical precision.
[IMAGE: Side-by-side comparison of global LCOE trends (solar, wind, coal) from 2010 to 2025, showing solar and wind crossing below coal and gas. Data source: IRENA or BloombergNEF.]
This article examines how this transition is rewriting the rules for developers, utilities, and institutional investors. We will unpack the hidden economic logic behind revenue optimization, the emerging supply chain bottlenecks that are not about panels or turbines, and the new investor playbook for navigating merchant price risk.
The Hidden Economic Logic: From Capacity Addition to Revenue Optimisation
Under the old subsidy-driven model, success was measured in megawatts installed. Developers raced to commission projects as quickly as possible to lock in feed-in tariffs or tax credits before they expired. The financial viability of a project was largely pre-determined by the subsidy level; operational performance beyond a baseline was secondary. Today, that logic has been inverted.
The new model demands revenue optimization across three dimensions: capacity factor improvement, curtailment mitigation, and merchant price exposure management. A project that generates electricity at peak solar hours when wholesale prices are low may be less profitable than one that pairs with battery storage to shift output into high-price evening windows. Similarly, a wind farm in a region with negative pricing during high-wind periods must either accept curtailment or invest in power-to-X technologies. The winners are those who can dynamically manage their energy output as a portfolio of real options.
This shift is most visible in the explosive growth of corporate power purchase agreements (PPAs). Between 2020 and 2024, global corporate PPA volumes doubled, with technology giants like Google, Amazon, and Microsoft signing multi-gigawatt deals. These contracts serve a dual purpose: they provide a fixed or floor price for renewable energy, reducing merchant risk, and they shift the credit assessment from the utility to the corporate off-taker. Banks now evaluate the investment-grade ratings of Amazon or Google when financing a project, often leading to lower interest rates and longer tenors than traditional utility PPAs.
[IMAGE: Infographic showing flow from developer to corporate PPA to bank financing, with key metrics: PPA price ($/MWh), tenor (15-20 years), off-taker credit rating (AAA/AA).]
The implications for project finance are profound. A BloombergNEF analysis shows that projects backed by high-credit corporate PPAs in the US achieved debt-to-equity ratios of 80:20 in 2023, compared to 70:30 for merchant or utility-PPA projects. This capital efficiency reduces the weighted average cost of capital (WACC) by 50–100 basis points, directly boosting internal rate of return (IRR). However, it also introduces a new risk: the off-taker's creditworthiness can change over a 20-year contract. Developers must now monitor corporate balance sheets as closely as they monitor wind speeds.
Supply Chain Under Pressure: The Next Bottleneck Is Not Panels
Conventional wisdom holds that the renewable energy supply chain is oversupplied. Solar module manufacturing capacity globally exceeded 800 GW in 2024, while annual installations were around 400 GW. Polysilicon prices have cratered. Wind turbine nacelles are abundant. Yet the industry faces a growing bottleneck that is not about panels or turbines—it is about grid interconnection, large power transformers, and high-voltage balance-of-system components.
The hidden trend is a global shortage of large power transformers (LPTs). Lead times for transformers rated above 100 MVA have stretched to 18–24 months, up from 6–8 months in 2019, according to Wood Mackenzie. This is not a temporary supply chain hiccup; it reflects structural underinvestment in specialized manufacturing capacity. Fewer than a dozen factories worldwide can produce the ultra-high-voltage transformers needed to connect large solar and wind farms to transmission grids. The situation is most acute in the United States, where transformer imports have been hit by Section 301 tariffs on Chinese steel and aluminum, and in Europe, where new environmental regulations have forced older foundries to close.
[IMAGE: World map highlighting regions with longest grid interconnection queues (US: ~2 TW in queue, UK: ~400 GW, Australia: ~300 GW) and transformer factory locations (concentrated in Germany, South Korea, China).]
The cascading effect on renewable energy investments is significant. A solar farm that secures all its panels and inverters within six months may still face a 24-month wait for a substation transformer. This delay increases project carrying costs, exposes developers to interest rate risk, and can cause PPAs to expire before commercial operation. The result is a growing premium for projects that already have interconnection agreements and transformer orders in place. In secondary markets, development-stage assets with secured grid access are trading at 20–30% higher multiples than those without.
Furthermore, trade tariffs on steel and aluminium are raising costs for mounting structures, cable trays, and grounding systems. The US Inflation Reduction Act (IRA) requires domestic content for bonus tax credits, but American steel production for balance-of-system components is limited. Developers are increasingly forced to choose between paying a premium for domestic products or forfeiting the 10% bonus credit. This tension between cost optimization and regulatory compliance is creating a new layer of complexity in project budgeting.
Investor Playbook: How to Navigate the Merchant Risk Frontier
As subsidies fade, the most consequential decision for renewable energy investors is how much merchant price risk to accept. In a fully contracted project with a 20-year fixed-price PPA, revenue is certain, but returns are capped. In a merchant project exposed to wholesale electricity prices, returns can be higher—but so is volatility. The historical correlation between renewable merchant revenues and natural gas prices has been strong, but that relationship is weakening as renewable penetration deepens.
Consider the case of California. During the 2020–2022 period, solar merchant prices in the CAISO market fell by 40% relative to gas-fired generation, driven by the "duck curve" effect of midday solar oversupply. Projects that had sold renewable energy certificates (RECs) separately but retained energy revenue suffered margin compression. Conversely, projects that paired solar with four-hour battery storage were able to capture evening peak prices that were 3–4 times the daytime average. The lesson is clear: merchant risk must be hedged through physical or financial instruments that account for time-of-day value.
[IMAGE: Graph showing solar + storage capture price vs. standalone solar merchant price in CAISO, 2021–2024, with evening peak price spikes highlighted. Source: LBNL or PJM data.]
The emerging solution is the hybrid project. Combining solar, wind, battery storage, and sometimes green hydrogen production under a single interconnection point allows developers to smooth output, reduce curtailment, and optimize revenue across multiple markets (energy, capacity, ancillary services). Hybrid projects also benefit from "co-location" economics: shared grid infrastructure, land, and operations reduce balance-of-system costs by 10–15% while improving capacity factors by 20–30%.
However, hybrid projects introduce their own complexities. Financing a multi-technology asset requires sophisticated modelling of correlated revenue streams. Lenders are still developing standardized underwriting criteria. Insurance markets are adjusting to the novel risk of battery degradation combined with wind turbine availability. And grid operators must adapt their interconnection agreements to account for variable dispatch profiles. The first movers in this space—companies like NextEra Energy, EDF Renewables, and Enel—are already building portfolios that treat each project as a financial portfolio of energy assets.
For institutional investors—pension funds, insurance companies, and infrastructure funds—the key is to develop internal capabilities to assess merchant risk, or to partner with experienced independent power producers (IPPs) that have proprietary revenue optimization algorithms. Direct indexing into renewable energy infrastructure funds that diversify across geographies, technologies, and offtake structures is becoming the preferred entry point. The next decade will belong to those who can model the complex interplay between weather, regulation, and market dynamics—not to those who simply count subsidies.
Conclusion: The New Profitability Logic
The transition from policy-driven to market-driven renewable energy profitability is not a gradual evolution; it is a structural break. Developers who built megawatts for feed-in tariffs now compete on operational excellence. Investors who relied on guaranteed returns now assess merchant risk curves. Supply chains that were dominated by panel and turbine manufacturers now depend on transformer foundries and grid interconnection queues.
The hidden profitability shift is about leverage points—where a small advantage in capital allocation, capacity factor optimization, or PPA negotiation compounds into outsized returns. A 1% improvement in capacity factor for a 500 MW wind farm, combined with a 5% reduction in financing costs from a corporate PPA, can increase project IRR by 150–200 basis points. These are the margins that separate industry leaders from laggards.
As renewable energy markets mature, the winners will not be those who build the most capacity. They will be those who manage risk across the entire lifecycle—from grid interconnection to off-taker credit to merchant price exposure. The subsidy era taught the world that renewable energy could be affordable. The post-subsidy era will prove that it can be profitable.