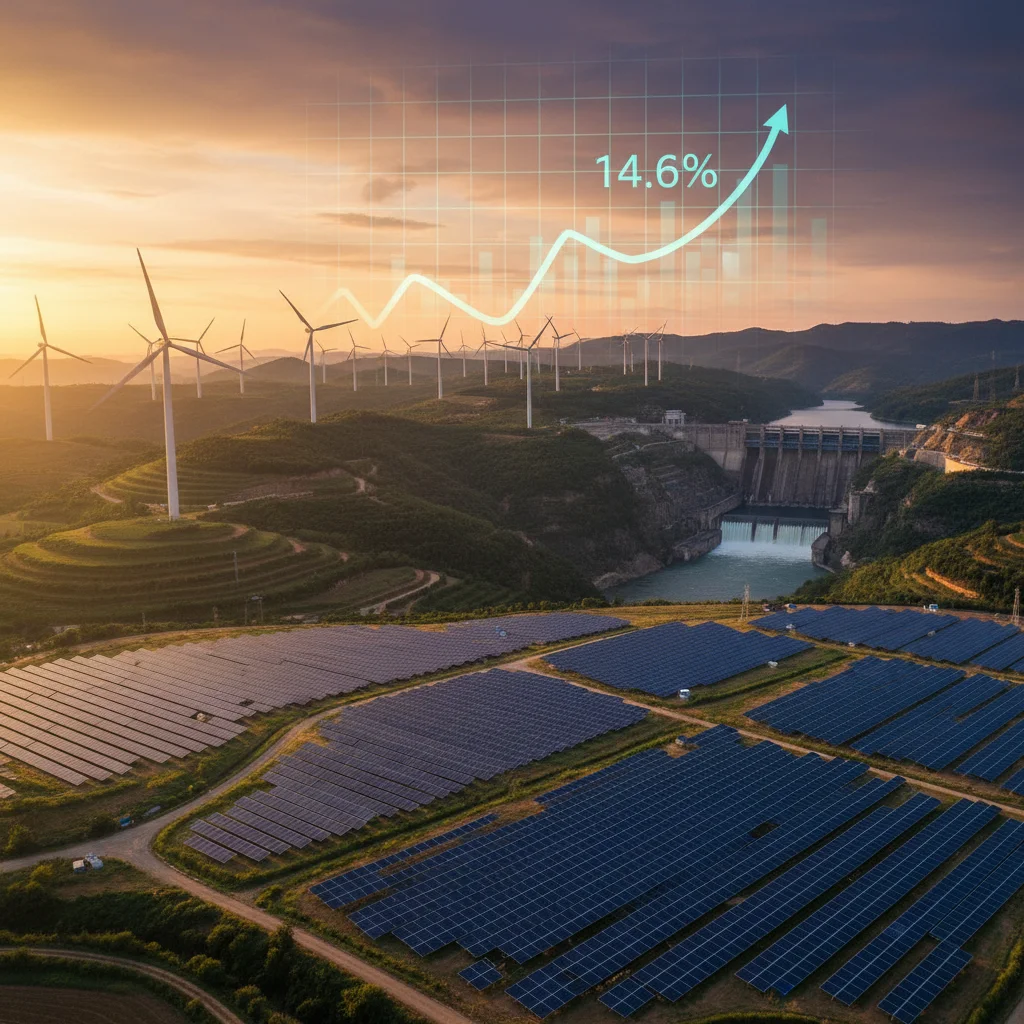
Renewable Energy Market to Hit $1.71 Trillion by 2025, Growing at 14.6% CAGR: A Deep Dive into Segment Dynamics and Supply Chain Realities
The global renewable energy market is poised for explosive growth, with a projected value of USD 1,711.51 billion in 2025 and a compound annual growth rate (CAGR) of 14.6% from 2026 to 2034, according to a new report by Polaris Market Research. This analysis goes beyond headline numbers to examine the underlying economic logic, segment-level divergence, and hidden supply chain pressures. While solar and wind drive the bulk of new capacity, hydropower remains a massive but slow-growing base. The report, covering historical data from 2021–2024 and forward forecasts through 2034, signals a critical need for grid modernization, energy storage, and strategic investments in critical minerals. Stakeholders must navigate these structural shifts to capture the full potential of the energy transition.
Renewable Energy Market to Hit $1.71 Trillion by 2025, Growing at 14.6% CAGR: A Deep Dive into Segment Dynamics and Supply Chain Realities
**By a Senior Technical/Financial Audit Journalist**
---
1. Setting the Stage: A $1.7 Trillion Market on a 14.6% CAGR Trajectory
The global renewable energy market reached a valuation of USD 1,711.51 billion in the base year 2025, and is projected to expand at a compound annual growth rate (CAGR) of 14.6% from 2026 to 2034, according to a new report by Polaris Market Research & Consulting, Inc. (Source: Polaris Market Research Report PM2147, authored by Pranshu Trivedi, 120 pages, published April 2026). The forecast covers product segments including Solar Power, Hydropower, Bioenergy, Wind Power, and Others, with historical data spanning 2021–2024 serving as the baseline for trend analysis.
A superficial reading of these headline numbers suggests a uniform acceleration of renewable adoption. However, a closer examination reveals structural divergence beneath the aggregate growth rate. Solar and wind power are the primary drivers of new capacity additions, while hydropower—the largest installed-base renewable—grows at a fraction of the overall CAGR. Bioenergy and emergent technologies (geothermal, marine, hydrogen) occupy smaller but strategically important niches. The 14.6% figure masks these internal dynamics, which carry distinct implications for capital allocation, grid integration, and raw material procurement.
---
2. Historical Context: What 2021–2024 Tell Us About the Momentum
The report’s historical period (2021–2024) coincides with three transformative shocks: the COVID-19 pandemic’s disruption of global supply chains, the Russia-Ukraine energy crisis that sent fossil fuel prices to record highs, and subsequent policy accelerations—the U.S. Inflation Reduction Act (IRA), the EU REPowerEU plan, and China’s updated Five-Year Plan for renewable energy. These events compressed decision-making cycles and spurred capital inflows into renewables at an unprecedented pace.
Key inflection points include:
- **2022–2023:** Record solar PV installations globally, exceeding 400 GW annually for the first time, driven by China’s manufacturing overcapacity and falling module prices.
- **2023:** Offshore wind levelized cost of energy (LCOE) dropped below USD 50/MWh in several European auctions, enabling project pipelines that previously were uneconomic.
- **2024:** Policy boosts from the IRA began translating into actual investment, particularly in U.S. solar manufacturing and battery storage co-location.
The 2021–2024 data provides a reality check for the 14.6% forward CAGR. Growth in the historical period was volatile—spiking in 2022–2023 due to energy security panic, then moderating in 2024 as interest rates rose and grid interconnection bottlenecks emerged. The forecast CAGR implies a sustained acceleration beyond 2025, which is plausible only if policy support remains consistent and critical infrastructure (transmission, storage, permitting) expands in lockstep.
---
3. Segment Deep Dive: Solar, Wind, Hydropower, Bioenergy, and the ‘Others’ Trap
Solar Power and Wind Power: High-Growth Engines with Hidden Bottlenecks
Solar and wind constitute the highest-growth segments, propelled by falling LCOE and massive manufacturing scale-up. Solar module manufacturing capacity has tripled since 2021, with China controlling over 80% of global polysilicon, wafer, cell, and module production. Wind turbine manufacturing is more geographically diversified but remains dependent on rare earth magnets (neodymium, dysprosium) and large-diameter bearings.
**Supply chain realities:** Polysilicon prices crashed in 2023–2024 due to overcapacity, compressing margins for manufacturers but lowering input costs for project developers. However, the concentration of supply poses geopolitical risk. For wind, rare earth prices remain volatile, and copper—a key material for cabling and transformers—faces a structural deficit as electrification demand grows. These bottlenecks could cap growth rates if not addressed through recycling, substitution, or new mining projects.
Hydropower: The Slow-Moving Giant
Hydropower remains the largest single source of renewable electricity generation globally, with an installed capacity exceeding 1,300 GW. However, its growth rate is far below the 14.6% CAGR: typical annual additions are 15–25 GW, representing a compound growth of roughly 2–3%. The constraints are structural: suitable river sites are increasingly limited, environmental and social opposition to large dams is rising, and project lead times often exceed a decade.
Hydropower’s role in the 2025–2034 forecast is as a stabilizing baseload provider, not a growth driver. Its importance lies in grid flexibility (pumped storage hydro) and seasonal energy storage, but new capacity will be overwhelmingly small-scale, run-of-river, or retrofitting existing dams.
Bioenergy and Others: Niche but Critical
Bioenergy (solid biomass, biogas, liquid biofuels) contributes roughly 5–8% of global renewable electricity and a larger share of renewable heat. Its growth is steady but constrained by feedstock competition with food crops and sustainability debates. The segment is most relevant for industrial decarbonization and aviation biofuels, where few alternatives exist.
The “Others” category—geothermal, marine (tidal, wave), and hydrogen—is often overstated in market reports. While these technologies have high growth rates from a low base, their absolute contribution to the 2034 market will remain under 3% unless breakthroughs in storage and cost occur. Investors should treat “Others” as a high-risk, high-reward call option, not a core driver.
---
4. Supply Chain Realities: The Hidden Tax on Growth
The 14.6% CAGR projection presupposes that the global supply chain for renewable energy components can scale without material disruptions. Several structural risks challenge that assumption:
- **Critical minerals:** A typical wind turbine requires 2–3 tonnes of copper and significant quantities of neodymium praseodymium. Solar PV uses silver, indium, and gallium. All these materials face demand growth outpacing supply through 2030, according to the International Energy Agency. Price volatility will erode project margins unless recycling rates improve.
- **Manufacturing concentration:** Over 90% of solar ingots and wafers are produced in China. Any trade disruption (tariffs, export controls, geopolitical conflict) would instantly impact global supply. Wind turbine nacelle assembly is more diversified, but gearboxes and bearings are still dominated by a few European and Japanese suppliers.
- **Grid and permitting:** The single largest bottleneck is not generation technology but the inability to connect new projects to transmission grids. Interconnection queues in the U.S. and Europe now last 4–7 years, far exceeding construction timelines. Without grid modernization, the installed capacity growth rate will decouple from financial market growth.
---
5. Forward Outlook: Neutral Market Predictions
Based on the data and structural analysis, three neutral predictions emerge for the 2026–2034 period:
1. **Solar will dominate incremental capacity additions** but face margin compression from overcapacity and trade fragmentation. Expect a 10–12% CAGR in solar installations, slightly below the overall market average, as lower hardware costs are partially offset by higher balance-of-system and interconnection expenses. 2. **Hydropower’s share of the market will shrink** to under 20% of total installed capacity by 2034, down from roughly 40% today. Its financial contribution may decline even faster due to low price elasticity and slow capacity growth. 3. **Supply chain risk will become a primary determinant of project viability.** Developers who secure long-term contracts for critical minerals, manufacturing capacity, and grid access will outperform those who rely on spot markets. The 14.6% CAGR is achievable only if simultaneous investments in transmission, storage, and material supply chains proceed at the same pace as generation assets.
Stakeholders must resist the temptation to treat the headline growth rate as uniform. The renewable energy market’s underlying economics reveal a story of divergence, concentration risk, and infrastructure dependency. The next decade will reward those who look beyond the CAGR and manage the real-world friction in the energy transition.