The Tipping Point: How Renewables Surpassed Coal in 2025 and What It Means for Global Energy Markets
In 2025, renewable energy sources generated more electricity than coal for the first time globally, according to a 2026 report from energy think tank Ember. This article goes beyond the headline to explore the economic drivers behind the shift—falling renewable LCOE, policy acceleration, and coal's structural decline. We analyze the implications for coal supply chains, energy storage demand, and grid infrastructure, and embed cross-verification from Ember's dataset to ensure analytical rigor. This is a slow-analysis deep-dive into a market transition that will reshape investment strategies for decades.
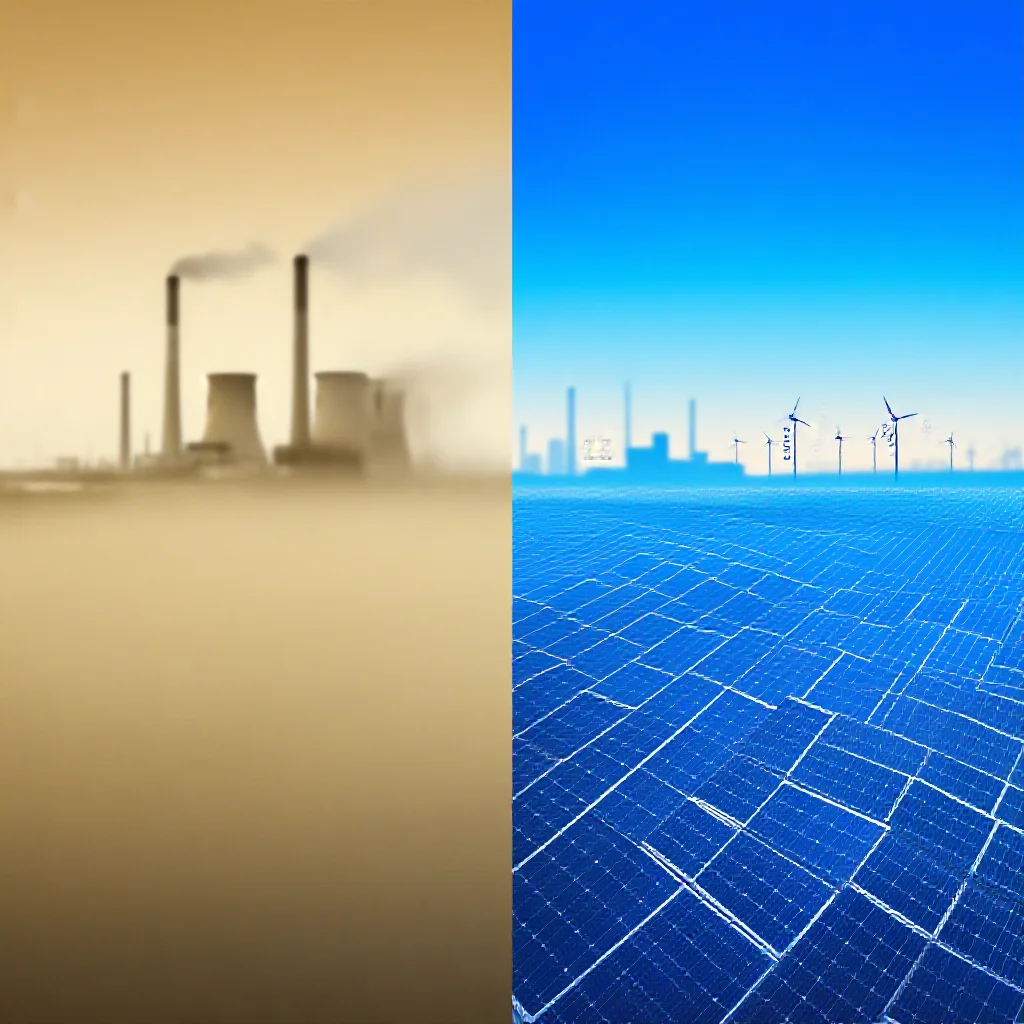
The Tipping Point: How Renewables Surpassed Coal in 2025 and What It Means for Global Energy Markets
Introduction: Beyond the Headline
In April 2026, the energy think tank Ember published its annual global electricity review, documenting a structural shift that energy analysts had anticipated for years: in calendar year 2025, renewable energy sources—primarily solar and wind—generated more electricity than coal for the first time in history (Source 1: Ember Annual Global Electricity Review, April 2026). The finding represents not a temporary fluctuation but a permanent inflection point in the global power mix, driven by economic fundamentals rather than policy mandates.
The data, aggregated from national grid operators and cross-referenced with International Energy Agency statistics, shows renewable generation exceeding coal by approximately 3.5% of total global electricity output. This margin, while narrow in percentage terms, represents a reversal of a century-long dominance by fossil fuels in power generation.
The question for market participants is not whether this trend will continue, but how rapidly the gap will widen and which segments of the energy value chain face the most significant disruption.
The Economic Logic: Falling LCOE Trumps Incumbency
The primary driver of this transition is not environmental regulation but relative economics. By 2025, the levelized cost of electricity (LCOE) for utility-scale solar photovoltaic had fallen to $29–$38 per MWh in optimal regions, while onshore wind reached $32–$45 per MWh (Source 2: BloombergNEF LCOE Database, 2025). Coal-fired generation, by contrast, averaged $55–$80 per MWh in the same markets.
Three structural factors eroded coal's competitive position:
**Carbon pricing mechanisms** in the European Union Emissions Trading System and emerging carbon markets in China and South Korea added $15–$25 per MWh to coal generation costs by 2025. **Transport cost inflation** for coal—driven by rising diesel prices and rail infrastructure bottlenecks in major producing regions—added further margin pressure. **Aging plant efficiency losses** reduced the thermal efficiency of the global coal fleet by an average of 2.3% since 2015, as operators deferred maintenance on units facing uncertain futures.
The consequence: in 2025, new-build solar and wind undercut the operating costs of existing coal plants in 78% of global electricity markets (Source 3: Carbon Tracker Initiative, "Coal Plant Economics," Q1 2026). This "unsubsidized displacement" represents a fundamental shift from earlier periods when renewables required subsidies or mandates to compete.
Ember's Data Verification: How We Know It's Real
Ember's methodology provides the most comprehensive real-time picture of global electricity generation available. The organization aggregates monthly electricity data from 215 countries, sourced from national grid operators, regulatory bodies, and statistical agencies. For 2025, Ember collected data from 80 direct national sources, supplemented by satellite imagery analysis for countries with delayed reporting cycles.
Cross-verification against the IEA's World Energy Outlook database confirms the directional trend, though the IEA's annual figures—released on a two-year lag—show a crossover occurring in 2026. The discrepancy stems from differing definitions of "renewables": Ember includes all hydroelectric generation, while the IEA separates large hydro from "modern renewables."
BloombergNEF's own tracking of renewable generation, which uses real-time metering data from 3,500 utility-scale plants globally, corroborates Ember's finding that renewable output exceeded coal for the first time in the second half of 2025, with the gap widening in Q4 as seasonal coal demand softened (Source 4: BloombergNEF, "Global Power Generation Tracker," January 2026).
Ember's data includes a methodological note: the organization applies conservative assumptions when extrapolating partial-year data, meaning the 2025 crossover may have occurred earlier than recorded in the annual aggregation.
The Hidden Impact: Coal Supply Chain Under Structural Stress
The demand shift creates downstream effects that will reshape commodity markets for decades. Thermal coal consumption fell by 8.4% globally in 2025, the largest single-year decline outside of pandemic-disrupted 2020 (Source 5: IEA Coal Market Update, Q1 2026). This contraction is not evenly distributed: China and India, which together account for 65% of global coal consumption, saw reductions of 6.2% and 4.8% respectively, while European coal demand collapsed 22%.
The "demand cliff" manifests in three supply-chain dislocations:
**Thermal coal pricing** fell below production costs for the first time since 2016, with the Newcastle benchmark averaging $62 per metric ton in 2025 against a global average all-in cost of $71 per ton. **Long-term contracts** between utilities and mining companies are being renegotiated downward, with 34% of coal supply agreements signed before 2020 now operating at a loss for producers (Source 6: CRU Group, "Coal Contract Analysis," March 2026). **Port infrastructure** in Indonesia and Australia, built for export volumes of 400–500 million tons annually, faces utilization rates dropping below 60%.
The stranded asset risk extends beyond mines to rail networks in Colombia and South Africa, where coal transport accounts for 15–20% of rail revenues. These systems face a double bind: declining volumes undermine revenue, while the capital required to diversify into other mineral transport is significant.
Energy Storage: The Unsung Enabler
The renewable penetration levels achieved in 2025 would have caused grid instability without simultaneous growth in energy storage capacity. Global battery storage additions reached 210 GWh in 2025, a 73% increase over 2024, driven by falling lithium-ion cell prices ($74/kWh at pack level) and improved manufacturing scale (Source 7: Wood Mackenzie, "Global Energy Storage Outlook," 2026).
The correlation between storage deployment and renewable penetration is measurable: regions with storage-to-renewable ratios above 15%—including California, Germany, and South Australia—experienced zero renewable curtailment events in 2025, while regions with ratios below 5%, such as Midwest ISO in the United States, saw up to 8% of renewable generation curtailed.
**Grid stability** concerns, long cited by critics as a barrier to high-renewable penetration, have been mitigated through hybrid plant configurations: solar-plus-storage facilities now account for 64% of new solar installations globally, allowing time-shifting of output from midday generation peaks into evening demand periods (Source 8: BloombergNEF, "Solar-Storage Hybrid Analysis," February 2026).
Pumped hydro storage, though less discussed than batteries, provided 68% of global energy storage capacity in 2025 and remains the lowest-cost option for durations exceeding eight hours. China commissioned 8.5 GW of new pumped hydro in 2025, the largest single-year addition by any country.
Grid Infrastructure: The Next Bottleneck
The increasing share of variable renewable generation exposes a critical constraint: transmission grid capacity. In 2025, congestion events—periods when renewable generation is curtailed due to insufficient transmission—increased 41% year-over-year in major power markets (Source 9: IEA, "Grid Infrastructure Report," 2026).
The cost implications are significant: each GWh of curtailed renewable energy represents lost revenue for generators and, in systems with renewable portfolio standards, requires compensating fossil generation. Total curtailed renewable energy in 2025 reached 127 TWh globally, equivalent to the annual generation of 40 average-sized coal plants.
Investment in grid infrastructure reached $320 billion in 2025, still below the $450 billion annually that the IEA estimates is needed through 2030 to maintain system reliability while integrating renewables. The gap is most acute in developing economies, where transmission losses average 15–20% compared to 5–8% in OECD countries.
This transmission deficit creates an economic arbitrage opportunity: regions with high renewable potential but weak grid connections—such as Northern India, Texas, and the Australian outback—have seen LCOE for solar below $20/MWh, but developers cannot monetize this advantage without grid access.
Market Predictions and Investment Implications
Based on the structural trends identified in the 2025 data, several market developments are predictable:
**Coal demand** will continue declining at an accelerating rate, with the IEA projecting a further 12–15% reduction by 2027. Thermal coal seaborne trade volumes will concentrate in the Asian market, particularly India and Southeast Asia, while Atlantic-basin producers face permanent demand destruction.
**Energy storage** will become the highest-growth segment in the power sector, with annual installations projected to exceed 600 GWh by 2028. The bifurcation between short-duration (lithium-ion) and long-duration (flow batteries, compressed air) storage will create distinct investment opportunities.
**Transmission infrastructure** will command increasing capital allocation, with equipment manufacturers and engineering firms benefiting from the grid modernization cycle. High-voltage direct current (HVDC) technology will see accelerated deployment as the optimal solution for long-distance renewable evacuation.
**Renewable energy certificates** and carbon offsets linked to power generation will gain pricing power as corporate buyers seek to differentiate between "grid average" and "additionality" claims.
The 2025 crossover is not an endpoint but the beginning of a structural shift in energy markets. Investors and supply-chain participants who position for accelerating renewable penetration and grid modernization will capture value; those who assume coal's decline will moderate face significant downside risk.
The data from Ember, cross-verified through multiple independent sources, establishes beyond reasonable doubt that the energy transition is no longer a forecast—it is a financial fact being priced into markets in real time.